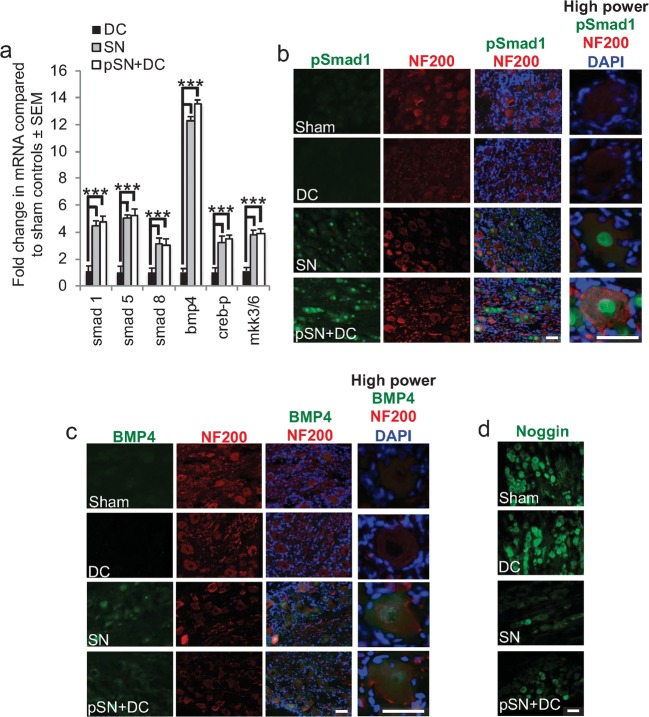
Fig. 2.
Changes in Smad1/BMP4 signalling pathway. a Q-PCR confirmed good correlation between microarray and Q-PCR data. b Immunohistochemistry for pSmad1 (green) in sections of regenerating (SN, pSN + DC) and non-regenerating (IC, DC) NF200+ DRGN (red) and of satellite cells (DAPI+ nuclei—blue). High levels of pSmad1 immunoreactivity were detected in occasional nuclei of regenerating SN and many nuclei of pSN + DC DRGN. c Immunohistochemistry for BMP4 (green) in sections of regenerating (SN, pSN + DC) and non-regenerating (IC, DC) NF200+ DRGN (red) and of satellite cells (DAPI+ nuclei–blue). BMP4 immunoreactivity was detected in most regenerating SN and pSN + DC DRGN. d Immunohistochemistry for Noggin in sections of regenerating (SN, pSN + DC) and non-regenerating (IC, DC) DRGN. Noggin immunoreactivity was highest in sham and DC whilst lower levels of immunoreactivity were detected in regenerating SN and pSN + DC DRGN. Scale bars in b–d = 50 μm

