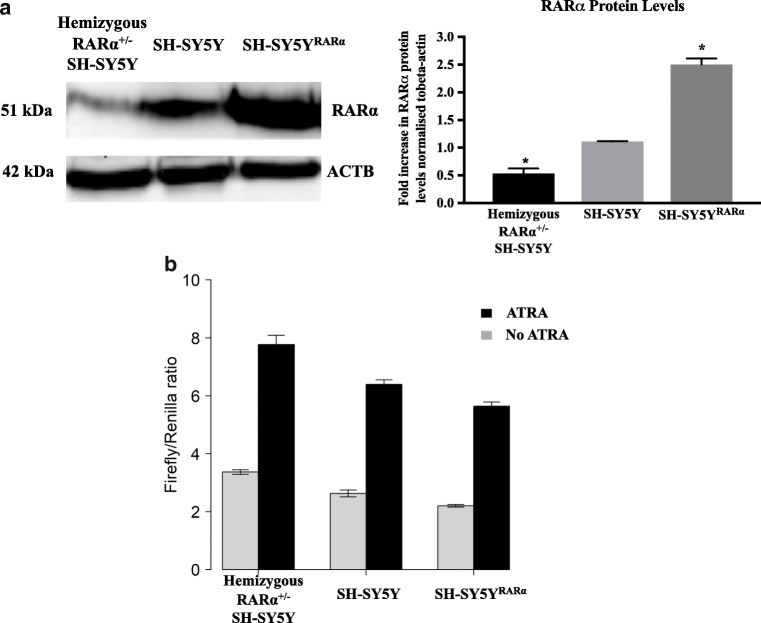
Fig. 5.
RARα levels influence the pattern of inhibition of translation. a A Western blot showing RARα levels in SH-SY5YRARα cells that overexpress the receptor after 1-μg doxycycline treatment for 24 h, SH-SY5Y cells and hemizygous RARα± SH-SY5Y cells. The graph shows the ratio of RARα levels normalised to β-actin (ACTB) for all three cell types. Shown are mean values of three biological replicates. Error bars indicate standard error of the mean (SEM) (*p ≤ 0.05, one-way ANOVA with Newman-Keuls multiple comparison test). b The three different SH-SY5Y cell lines were transfected with pTK1 containing the rat GluR1 5′ UTR region and pRL-TK, and treated with/without 10-μM ATRA. After 24 h, cells were lysed and luciferase activity was measured. The firefly luciferase activity was normalised with respect to Renilla luciferase activity. Shown are the average of normalised luciferase levels (firefly/Renilla) of three biological replicates. Error bars indicate SEM. The data were analysed using a linear model with ATRA treatment and RARα expression (ordered factor) as explanatory variables (see text)

