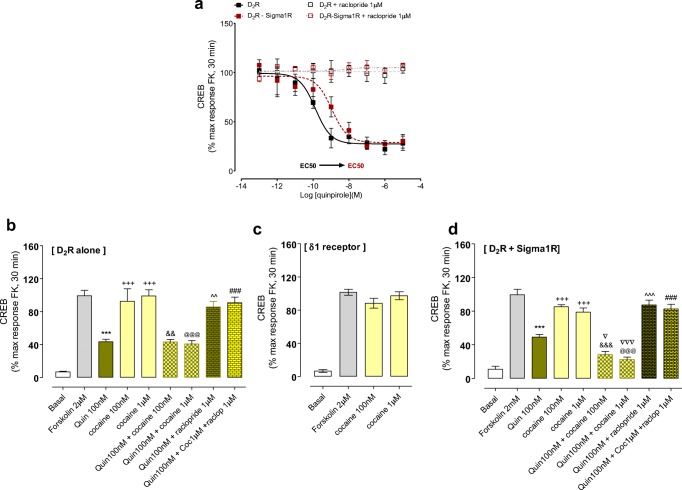
Fig. 4.
CREB signaling experiments. a In HEK cells cotransfected with D2LR and δ1R cDNAs vs cells singly transfected with D2LR cDNA, the inhibition of CREB signaling obtained with increasing concentrations of quinpirole was shifted to the right upon cotransfection (D2R (LogIC50 = −9.87 ± 0.17), D2R-δ1R (LogIC50 = −8.95 ± 0.22)). b In singly D2R cDNA-transfected cells the inhibition of CREB by quinpirole after forskolin-induced activation of CREB was unaffected by cocaine (100 nM and 1 μM) and cocaine alone in these concentrations lacked effects on the forskolin-induced increase in CREB signaling. The data represent the means ± S.E.M. of three independent experiments performed in triplicate. Statistical analysis was performed by one-way analysis of variance (ANOVA) followed by Tukey’s multiple comparison post-test. The P value 0.05 and lower was considered significant. ***Significantly different compared to Forskolin 2 μM (P < 0.001); +++Significantly different compared to quinpirole 100 nM (P < 0.001); &&Significantly different compared to cocaine 100 nM (P < 0.01); @@@Significantly different compared to cocaine 1 μM, (P < 0.001); ^^Significantly different compared to quinpirole 100 nM (P < 0.01); ###Significantly different compared to quinpirole 100 nM + cocaine 1 μM (P < 0.001). c In cells singly transfected cells with Sigma1R, cocaine (100 nM and 1uM) again lacked effects on the forskolin (2 μM) induced activation of CREB signaling. The data represent the means ± S.E.M. of three independent experiments performed in triplicate. Statistical analysis was performed by one-way analysis of variance (ANOVA) followed by Tukey’s multiple comparison post-test. d In cells cotransfected with D2LR and δ1R cDNAs, cocaine at 100 nM and 1 μM was instead able to significantly enhance the inhibitory actions of quinpirole on forskolin-induced increase in CREB activity. By itself, cocaine in these concentrations failed to significantly influence the forskolin-induced activation of CREB activity. The data represent the means ± S.E.M. of three independent experiments performed in triplicate. Statistical analysis was performed by one-way analysis of variance (ANOVA) followed by Tukey’s multiple comparison post-test. The P value 0.05 and lower was considered significant. ***Significantly different compared to Forskolin 2 μM (P < 0.001); +++Significantly different compared to quinpirole 100 nM (P < 0.001); &&&Significantly different compared to cocaine 100 nM (P < 0.001); @@@Significantly different compared to cocaine 1 μM (P < 0.001). Δ and ΔΔΔSignificantly different compared to quinpirole 100 nM (P < 0.05 and P < 0.001); ^^Significantly different compared to quinpirole 100 nM (P < 0.0^01); ###Significantly different compared to quinpirole 100 nM + cocaine 1 μM (P < 0.001). Abbreviations; raclop: raclopride, coc: cocaine, quin: quinpirole

