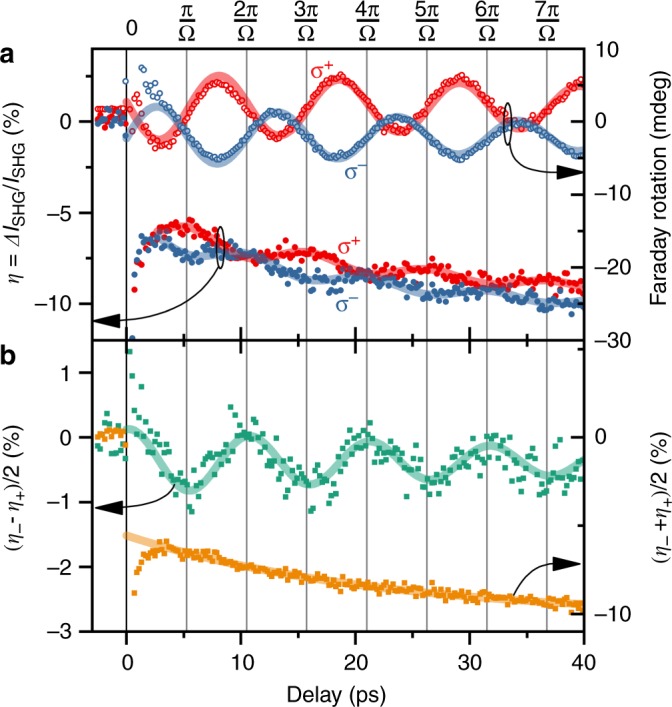
Fig. 2.

Experimental observation of coherent spin dynamics by Faraday rotation and SHG. Typical measurement of optically induced spin dynamics by σ+-polarised (red) and σ−-polarised (blue) pump pulses. a Open circles represent Faraday rotation. Closed circles show the relative change of SHG intensity. Solid lines are damped sine (Faraday) and cosine (SHG) fits. b Difference (green) and average (orange) of TR SHG changes corroborating helicity-dependent and helicity-independent contributions, respectively. Solid lines represent fits according to a damped cosine (green) and a single exponential decay (orange)
