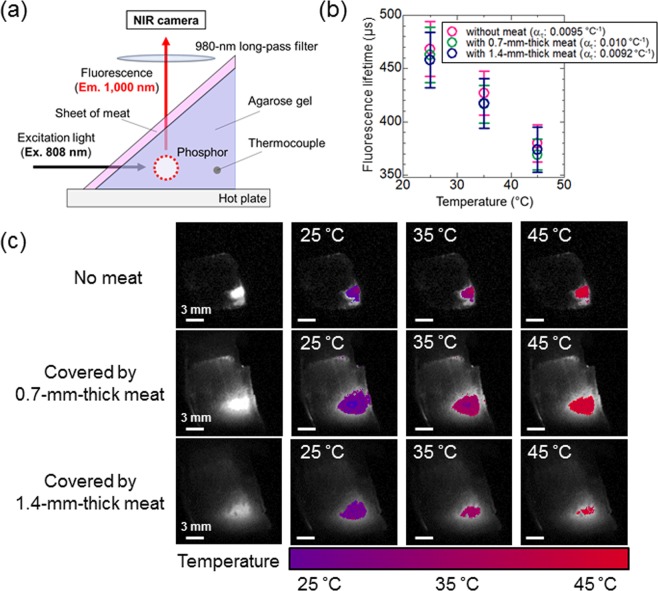
Figure 4.
Thermal images obtained by calculation from the calibration curves of the thermally sensitive phosphor in Fig. 3. (a) Schematic representation of the biological deep imaging experiment using agarose gel and thin meat sheets. A hot plate was used as a heat source. (b) Thermal sensitivity of NaYF4: Nd3+, Yb3+ at each experimental condition. (c) Thermal images of NaYF4: Nd3+, Yb3+ while heating the biological tissue phantom from 25 °C to 45 °C with and without meat. Integration times: the sample without meat, 30 μs; the sample with one or two sheets of meat, 1000 μs. Laser power: 20 W/cm2.

