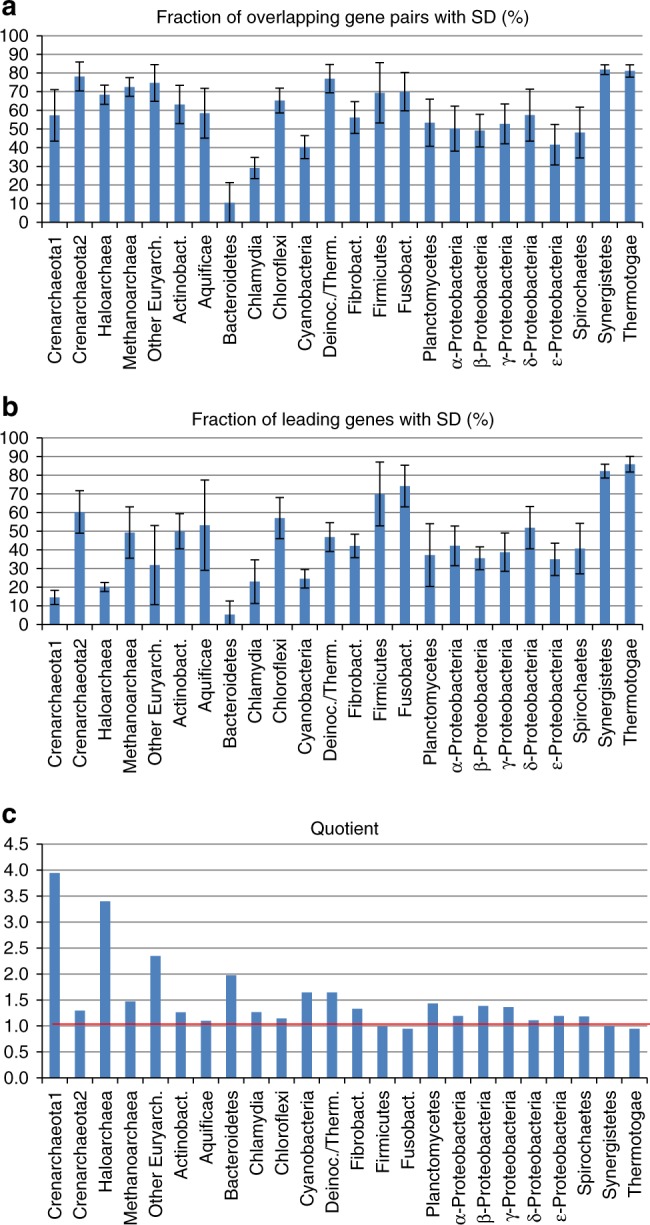
Fig. 3.

SD sequences in 720 genomes of 24 groups of prokaryotes. a Fractions of overlapping gene pairs that contain a SD motif upstream of the downstream gene, in the 3′-region of the upstream gene. Mean values and standard deviations are shown. b Fractions of leading genes that are preceded by a SD motif. Mean values and standard deviations are shown. c The quotient of the values shown in a and b, which represents the relative importance of the SD motif at downstream genes of overlapping gene pairs versus leading genes
