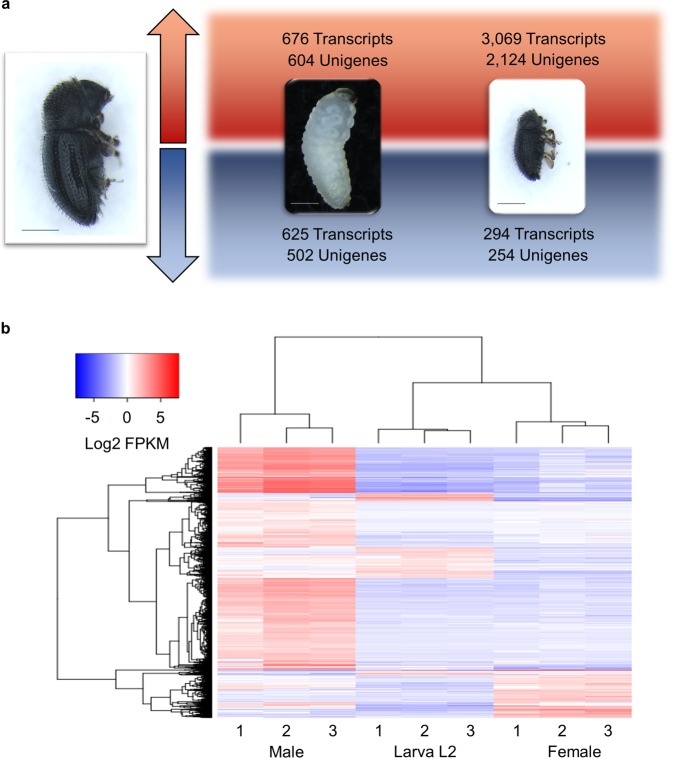
Figure 2.
Pairwise comparisons of differentially expressed genes between the different developmental stages of H. hampei. (a) Number of transcripts and unigenes differentially expressed in L2 larvae and males in reference to females. Red and blue arrows represent upregulated and downregulated genes, respectively. The scale bar shown in insect pictures corresponds to 500 µm. (b) Heatmap and clustering of all DEGs. Rows represent single transcripts, and columns represent the replicates for each developmental stage. Genes were clustered based on expression similarity (Euclidean distance). Blue and red colors in the heatmap correspond to low and high relative gene expression, respectively.

