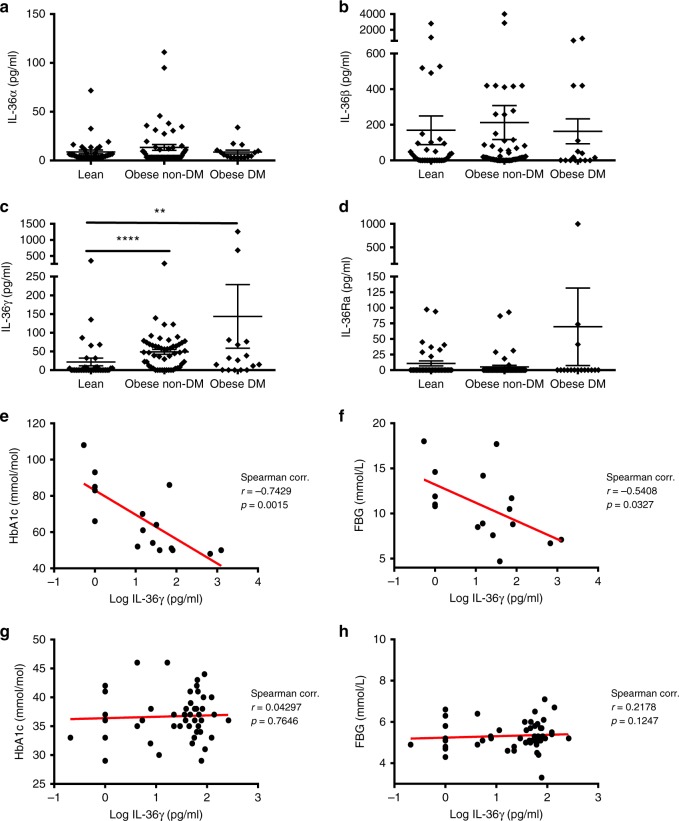
Fig. 1.
IL-36 cytokine expression levels in the serum of obese patients. a–d IL-36α, β, γ and IL-36Ra levels in the serum of lean individuals (n = 37), obese non-diabetic patients (HbA1c < 48) (n = 51) and obese with diabetes (HbA1c ≥ 48) (n = 16), as measured by ELISA. e–h Correlation analysis of IL-36γ levels with HbA1c and FBG in the serum of diabetic obese patients (e, f) and non-diabetic obese patients (g, h). Spearman correlation coefficient (r) and the corresponding p value shown. For (a–d) data are shown as means ± SEM, statistical analysis by two-tailed Mann–Whitney test, **p < 0.01, ****p < 0.0001. DM: diabetes mellitus. Source data are provided as a Source Data file

