Fig. 3.

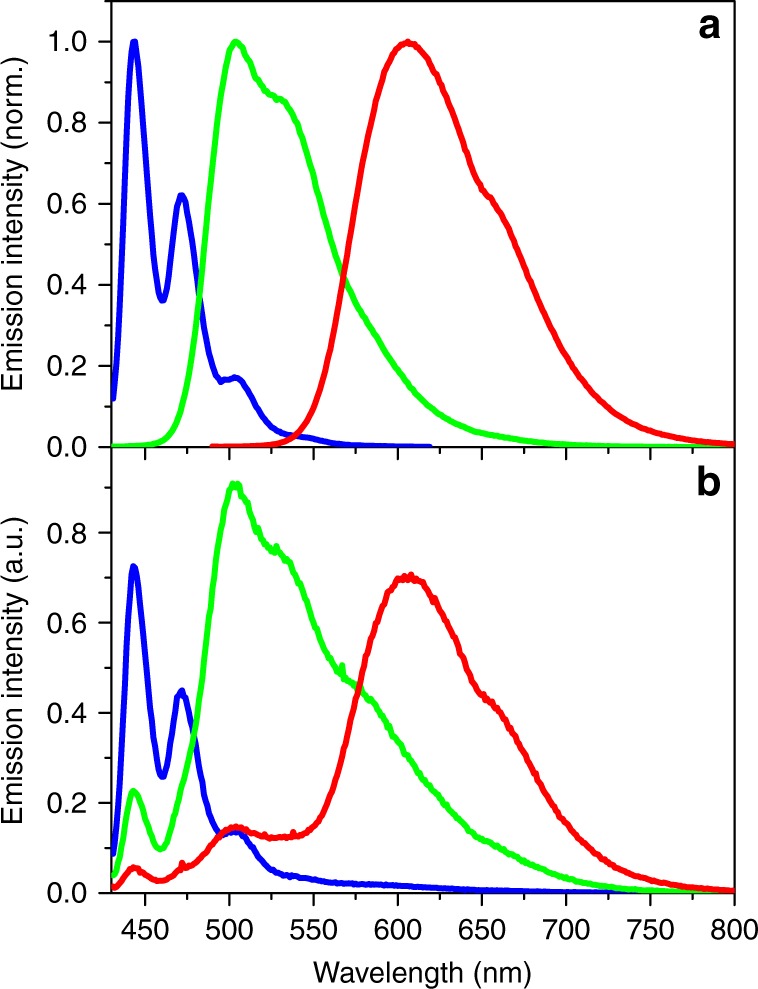
Emission spectra in the polymer micelles. a Normalized emission spectra of per (blue line), DAEg(c) (green line), and DAEr(c) (red line) in the polymer micelles. b Emission spectra of the tri-component micelle cocktail before UV irradiation (blue line), after exposure to 242 nm light (4 nm spectral bandwidth, 10 min irradiation time, green line) and after exposure to 415 nm light (4 nm spectral bandwidth, 2.5 h exposure time, red line). All spectra in panel (b) were recorded upon excitation at 423 nm. The relative emission intensities determined by spectral integration in (b) are 1.3:4.4:3.7 (blue:green:red), that is, the system displays fairly small intensity variations accompanying the emission color changes
