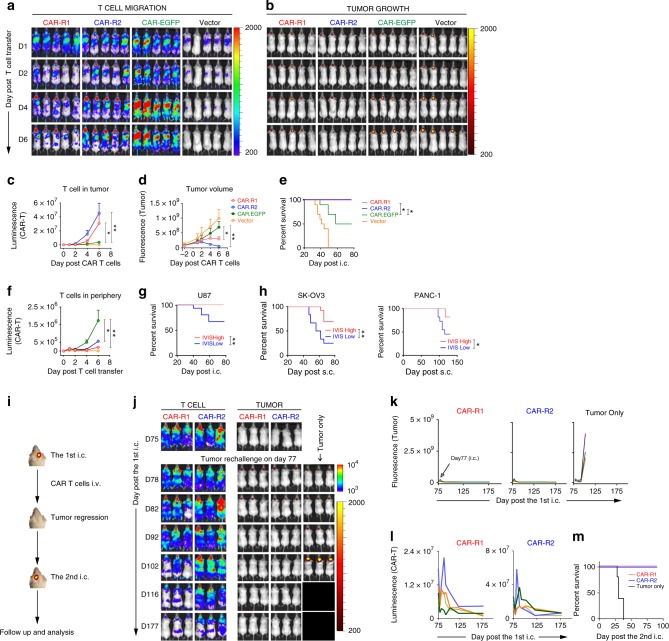
Fig. 6.
8R70CAR T cells cure late-stage tumors and provide long-term protection. a, b The 8R70CARs and un-mod-70CAR T cells in treating a late-stage tumor model. Compared with the experiment in Fig. 3a, the local radiation was delayed until day 22 and day 23, followed by CAR T-cell injection i.v. on day 29. Images show CAR T-cell tumor trafficking and tumor growth after adoptive transfer. c, d Kinetics of T-cell tumor trafficking and tumor growth at ROI. Data represent means ± SEM. e Survival of CAR-R1, CAR-R2, CAR-EGFP, and vector-treated mice. Kaplan–Meier survival curves are displayed. f Quantitation of T-cell signals in the periphery using the data shown in (a). g The correlation between early IVIS imaging signals post-treatment and survival in GBM. Mice of all three CAR T cell-treated groups described in (a) were stratified into low and high groups based on the median value of luminescence signals by IVIS, 1 day post-treatment. The survival difference between the groups was determined by Kaplan–Meier survival analysis. h Confirmative analysis of the correlation between early T-cell signals (3 days post-treatment) and survival using the results of the ovarian and pancreatic tumor models described in Fig. 3i, k, n, and p. i Experimental schema of tumor rechallenge. j Representative images of cured mice and tumor rechallenge. The cured mice treated by the CAR-R1, CAR-R2 T cells were i.c. inoculated with fresh tumors on the contralateral site with 5 × 10⁴/mouse U87.i720 on day 77 after first tumor implantation. Tumor-only controls represent naïve mice with the same tumor implantation. k, l Tumor growth and CAR T-cell tumor trafficking following tumor rechallenge. Each line represents a single mouse. m Kaplan–Meier survival curves of the rechallenged mice (four mice/group). The Mann–Whitney U test was used, and the log-rank test was used for the survival analysis. *p < 0.05, **p < 0.01

