Fig. 1.
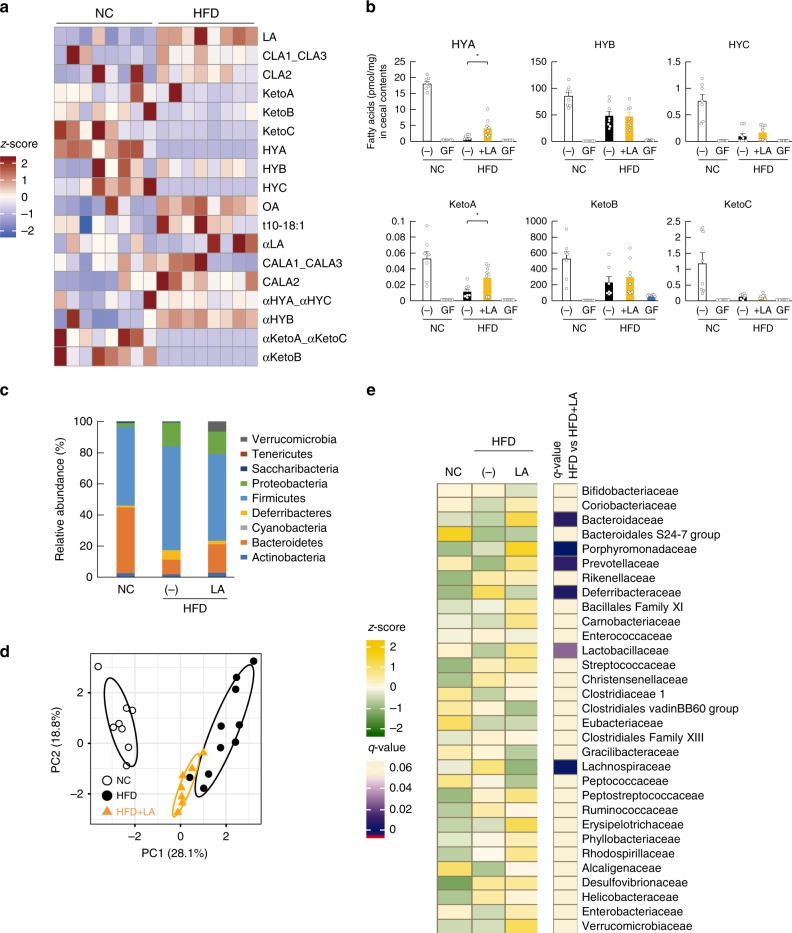
Effects of dietary PUFAs on gut microbiota composition and PUFA metabolites. a Heat map of gut microbial PUFA metabolites in cecal content (n = 8 per group). b LA-derived gut microbial PUFA metabolites in cecal content were quantified (n = 7, 10, 8, 8, and 8 per group for HYA; n = 8,10, 8, 8, and 8 per group for HYB; n = 7, 10, 8, 8, and 10 per group for HYC; n = 8, 10, 8, 8, and 10 per group for KetoA; n = 7, 10, 7, 8, and 8 per group for KetoB; n = 8, 9, 8, 8, and 8 per group for KetoC). *P < 0.05 (Tukey–Kramer test). c–e Gut microbial composition was evaluated in order to determine the relative abundance of microbial taxa (c), diversity (d), and abundance of the bacterial domain at the family level (e) (n = 8, 10, and 7 per group). (−)_NC represents normal chow-fed mice, and (−)_HFD represents high-fat diet-fed mice. q < 0.05. Results are presented as means ± SE. Source data are provided as a Source Data file 1

