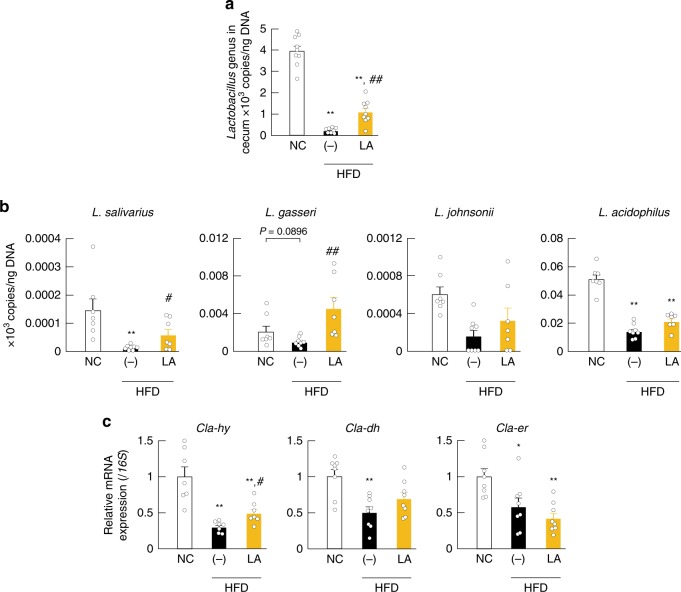
Fig. 2.
HYA-producing lactic acid bacteria. a The abundance of Lactobacillus was analyzed by qPCR (n = 9, 8, and 9 per group). b The abundance of the Lactobacillus strains (n = 7, 8, and 7 per group) and c the relative mRNA expression of metabolite-synthesizing enzymes (Cla-hy, Cla-dh, and Cla-er; see Supplementary Fig. 1) (n = 7 per group for Cla-hy; n = 8 per group for Cla-dh and Cla-er) in cecum were analyzed by qPCR and qRT-PCR. **P < 0.01, *P < 0.05 vs. NC (Tukey–Kramer test). ##P < 0.01; #P < 0.05 vs. (−) (Tukey–Kramer test). (−)_HFD represents high-fat diet-fed mice. Results are presented as means ± SE. Source data are provided as a Source Data file 2

