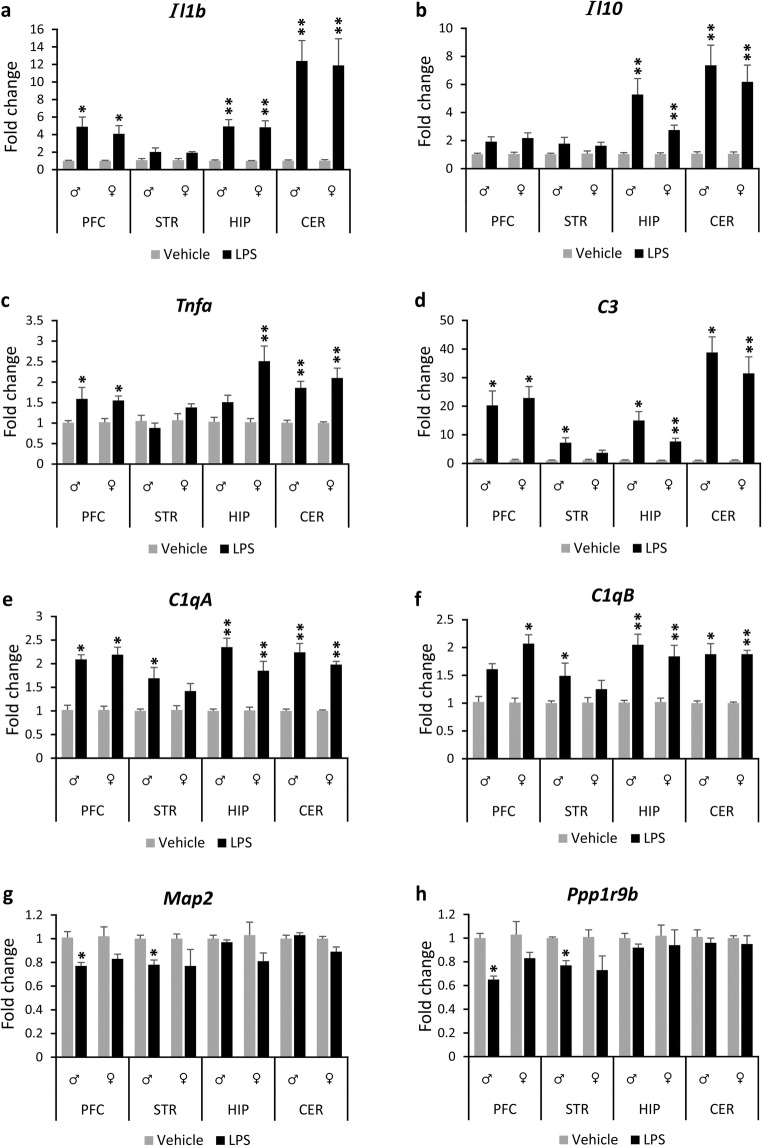
Fig. 2.
Brain region-specific changes in gene expression at P6 in response to neonatal LPS challenge. Bar graphs show gene expression levels of cytokines (Il1b, Il10, Tnfa; a–c), complement system factors (C1qA, C1qB, C3; d–f) and neuronal markers (Map2, Ppp1r9b; g, h) in the prefrontal cortex, striatum, hippocampus and cerebellum of exposed male and female mice and their respective controls. All data (a–h) are presented as means (± SEM). (n = 6/condition/sex). *p < 0.05, **p < 0.01 when compared with their respective control groups. Abbreviations: Il-1b interleukin 1beta, Il10 interleukin 10, Tnfa tumour necrosis factor alpha, C1qA alpha chain of complement C1q subcomponent, C1qB beta chain of complement C1q subcomponent, C3 complement component 3, Map2 microtubule-associated protein 2, Ppp1r9b protein phosphatase 1 regulatory subunit 9B, PFC prefrontal cortex, STR striatum, HIP hippocampus, CER cerebellum, LPS lipopolysaccharide

