Fig. 3.
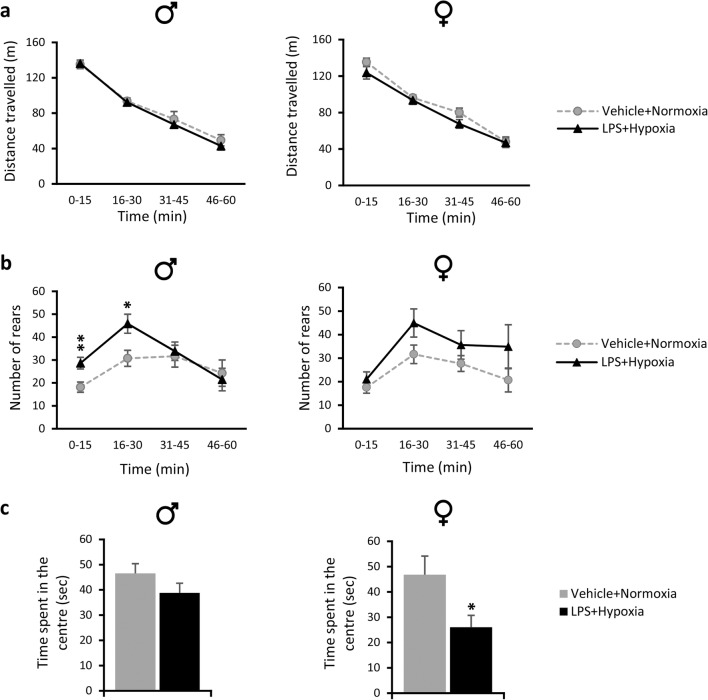
Performance of adolescent (P28) mice in the open-field test after the neonatal double hit of LPS and hypoxia. a, b Lines show the average distance travelled (m) (a) and the average number of rears (b) in 15-min time bins across a 60-min session in an open-field test by exposed male and female mice (black triangles) and their respective control groups (grey circles). c Bars show the time spent in the centre (sec) of the open-field box during the first 15 min of testing by exposed male and female mice (black bars) and their respective control groups (grey bars). All data are expressed as means ± SEM (n = 13–19/condition/sex). *p < 0.05, **p < 0.01 compared to their respective control groups. Abbreviation: LPS lipopolysaccharide

