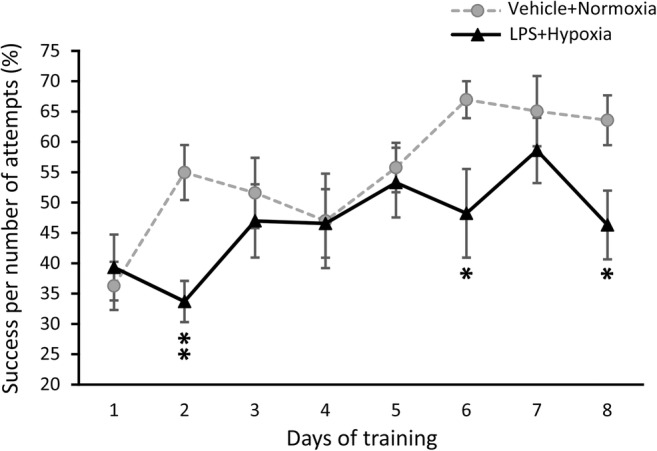
Fig. 4.

Daily performance of adolescent (P38–47) male mice in the skilled reaching task (SRT). The line graph shows the percentage of success per number of attempts in the 8-day training period of the SRT by exposed to LPS and hypoxia male mice (black triangles) and their respective control group (grey circles). Data are expressed as means ± SEM (n = 5–6/group). *p < 0.05, **p < 0.01 compared to the control group. Abbreviation: LPS lipopolysaccharide
