Fig. 7.
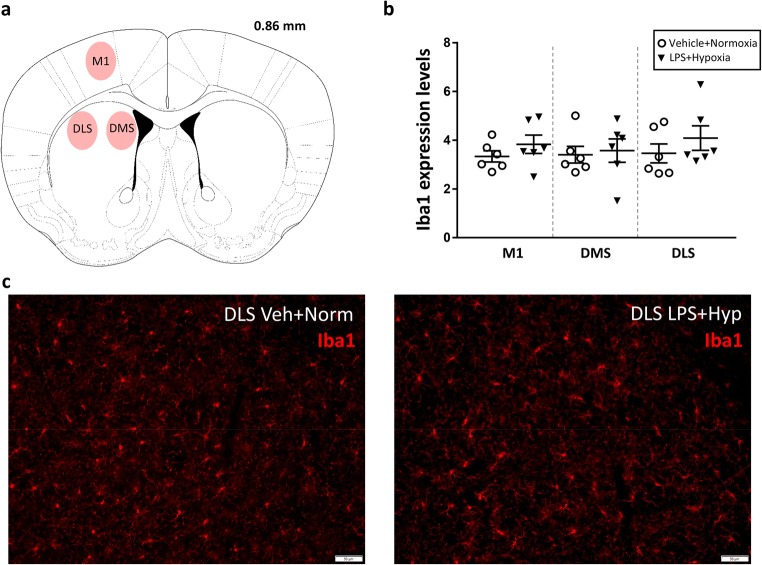
Microglia morphology and density in the primary motor cortex and striatum of adolescent male mice, as judged by ionised calcium binding adaptor molecule 1 (Iba1) immunostaining. a Drawing illustrating the location where the IBA1 measurements were obtained. Coronal sections are marked in millimetres from the bregma according to the Mouse Brain atlas of [50]. Labelled areas correspond to the following brain regions: primary motor cortex (M1), dorsomedial striatum (DMS) and dorsolateral striatum (DLS). b Scatter plots showing means (± SEM) and individual values of IBA1 expression levels in M1, DMS and DLS areas of control and exposed mice (n = 6/group). c Representative images of 20-μm-thick IBA1 immunostained brain sections from one control and one exposed mouse. Scale bars: 50 μm. Abbreviations: Veh vehicle, Norm normoxia, LPS lipopolysaccharide, Hyp hypoxia

