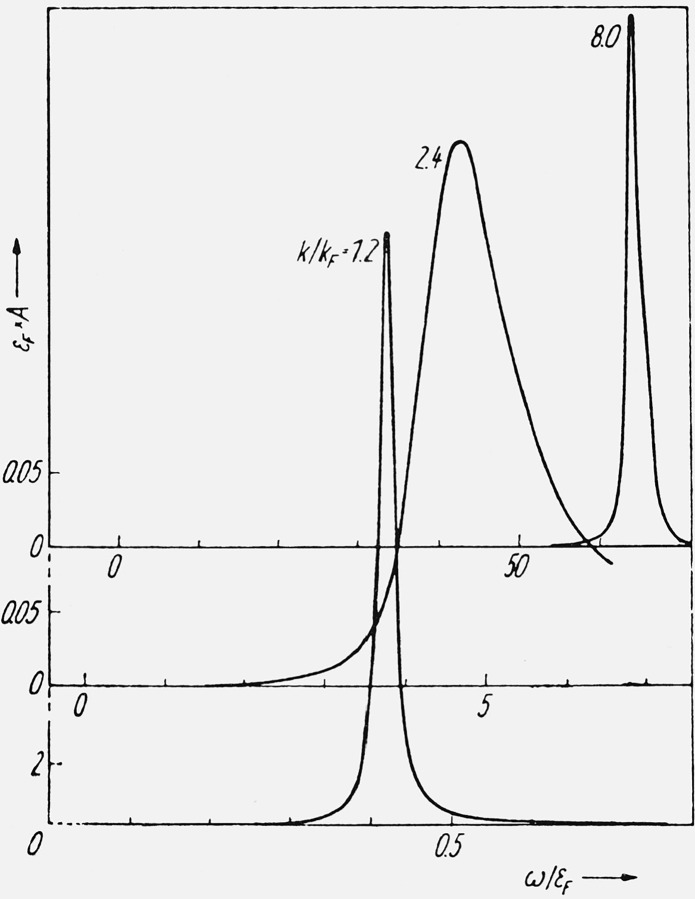
Figure 8.
Typical spectral forms for the quasi-particle peak of the spectral weight function in different momentum regions. The scales are different for the three curves, the energy ω is measured from the Fermi level μ, and the curves are drawn for rs = 4 [24].

