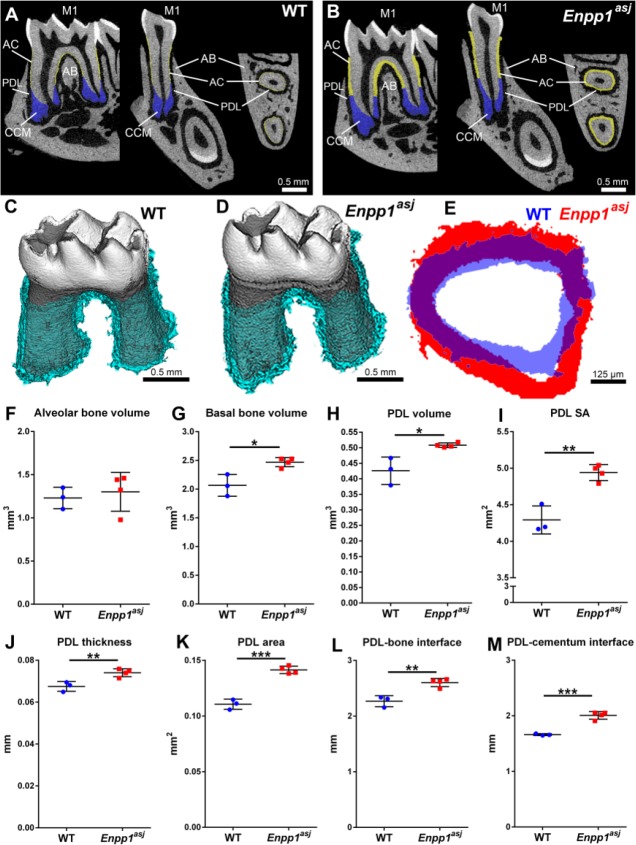
Figure 2.
Altered periodontium in Enpp1 mutant mice. (A, B) Two-dimensional micro–computed tomography (CT) reconstructions of wild-type (WT) and Enpp1asj mouse mandibles highlighting the mandibular first molar (M1) in sagittal, coronal (buccal-lingual), and transverse planes (respectively, left to right). Acellular cementum (AC) is highlighted in yellow and cellular cementum (CCM) is highlighted in blue. Note the dramatically expanded AC in Enpp1asj mice versus WT, although the periodontal ligament (PDL) space is maintained between M1 and alveolar bone (AB). (C, D) Three-dimensional micro-CT reconstructions of WT and Enpp1asj mandibular molars separated from alveolar bone socket. Segmented PDL space around molar roots is highlighted light blue. (E) Overlay of PDL thickness from M1 mesial roots shows that Enpp1asj PDL (red) is maintained and expanded over WT PDL (blue). (F) Alveolar bone volume shows no significant differences between WT and Enpp1asj mice. (G) Basal bone volume is significantly increased (*P = 0.01) in Enpp1asj versus WT mice. (H) Enpp1asj mice display a significant (*P = 0.01) increase in PDL volume around the first molar. (I) Surface area (SA) of PDL interface with bone and tooth is significantly (**P = 0.002) increased in Enpp1asj versus WT mice. Using a 50-slice (300-µm) region of interest midway down the mesial molar root, Enpp1asj mice display (J) significantly increased PDL thickness (**P = 0.009) and (K) significantly increased PDL-bone/tooth SA (***P = 0.0001) compared to WT controls. Separating the bone and tooth sides of the PDL interface confirms (L) significantly increased bone-PDL surface SA (**P = 0.004) and (M) cementum-PDL SA (***P = 0.0004) compared to WT controls.

