Figure 4.
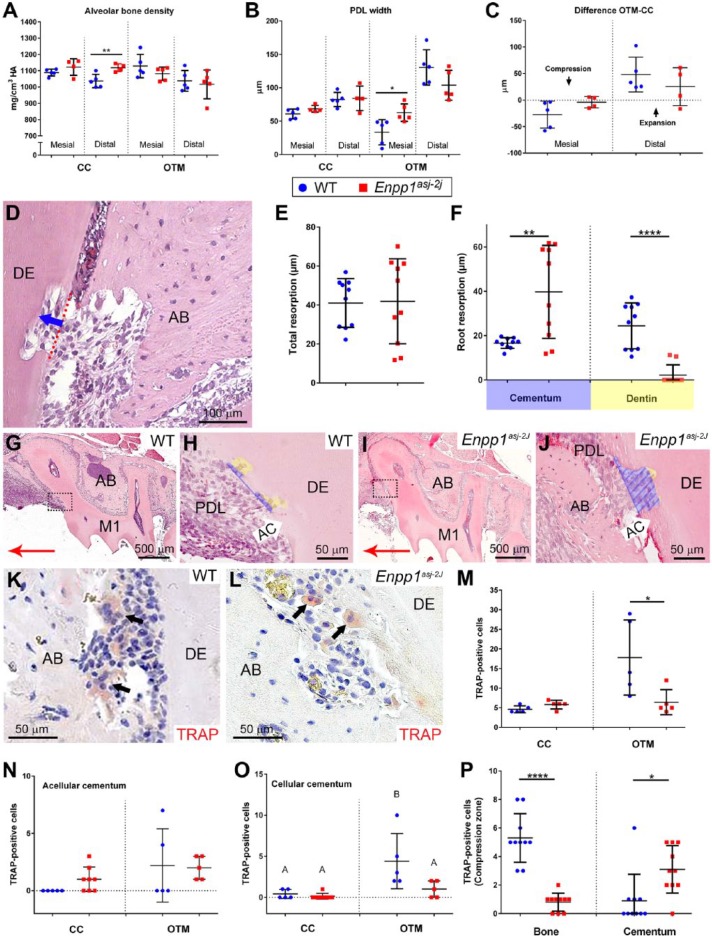
Altered periodontal parameters, resorption, and osteoclast distribution in Enpp1 mutant mice under orthodontic loading. (A) Alveolar bone (AB) densities on mesial and distal aspects of the contralateral control (CC) roots display mean increases in Enpp1asj-2J (red squares) versus wild-type (WT) (blue circles) mice, although only the distal aspect is significant (**P = 0.01). On orthodontic tooth movement (OTM) sides, Enpp1asj-2J mice showed nonsignificant mean decreases in AB density. (B) On CC sides, mean periodontal ligament (PDL) widths are increased in Enpp1asj-2J versus WT molars but do not reach significance (P = 0.12 and 0.86). On OTM sides, mesial PDL widths are significantly increased (*P = 0.02) and distal PDL widths nonsignificantly (P = 0.12) decreased in Enpp1asj-2J versus WT molars. (C) Enpp1asj-2J PDL displays less change on both mesial and distal aspects when calculated as differences between OTM and CC sides. (D) Linear measurements of resorption depth into AC and dentin (DE) were made in compression zones on OTM sides. Red-dotted line indicates original surface while blue arrow shows path of depth measurement. (E) No mean difference (P = 0.92) is observed between WT and Enpp1asj-2J mice in overall resorption depth. (F) Separating resorption depths for AC and DE reveals a 150% increase in AC resorption (**P = 0.003) and a 92% decrease in DE resorption (****P < 0.0001) in Enpp1asj-2J versus WT mice. (G–J) Histological images of resorption in AC (blue shading) and DE (yellow shading) in compression zones (boxes in G and I) of WT and Enpp1asj-2J mice. Red arrows in G and I indicate mesial direction. Focusing on compression zones of M1 distal roots, numbers and distribution of tartrate-resistant acid phosphatase (TRAP)–positive osteoclast/odontoclast-like cells (black arrows) were counted in (K) WT and (L) Enpp1asj-2J mice. (M) On CC sides, the baseline number of TRAP-positive cells is not significantly different (P = 0.09), while on the OTM side, Enpp1asj-2J mice exhibit a significant (*P = 0.04) 64% reduction in TRAP-positive cells compared to WT. (N) No significant differences in TRAP-positive cells are observed on AC surfaces of WT versus Enpp1asj-2J mice. (O) No differences in TRAP-positive cells are found on cellular cementum (CCM) of WT versus Enpp1asj-2J mice on the CC side, but OTM induces increased osteoclast-like cells on WT CCM but not Enpp1asj-2J CCM. In panel L, different capital letters indicate significant differences (P < 0.05) between means. (P) Separating TRAP-positive cells by localization to AB or cementum surfaces reveals a significant (****P < 0.0001) 85% reduction in TRAP-positive cells on AB surfaces and a 200% increase (*P = 0.01) in TRAP-positive cells on root surfaces in Enpp1asj-2J versus WT mice.

