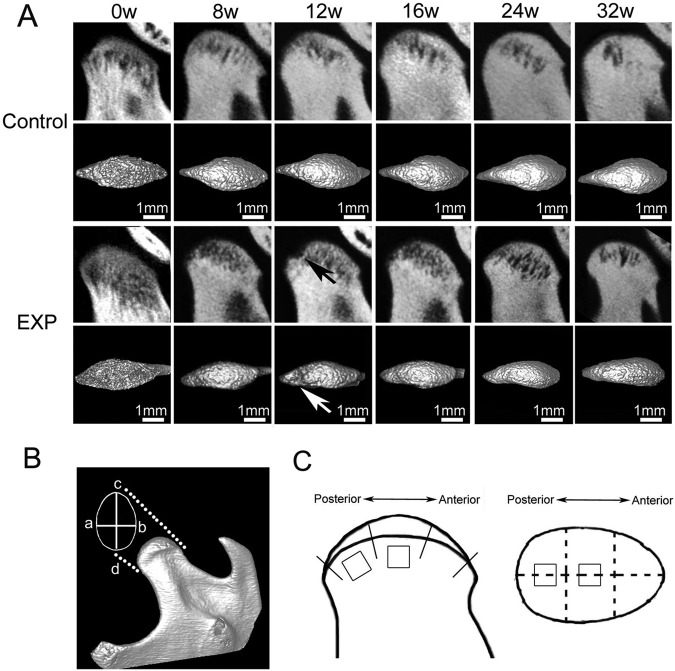
Figure 1.
In vivo micro-CT images of the TMJ condylar head from the control and experimental (EXP) groups. (A) The images were arranged from left to right according to the time sequence. Local subchondral bone lesions were observed in the experimental group. In general, the lesion regions (indicated by arrows) were larger at 12 wks after surgery than those at the other time-points. (B) Illustration of the methods for measuring the width (a–b) and length (c–d) of the condylar head. (a) The outermost point of the ventral contour of the condyle, (b) the outermost point of the dorsal contour of the condyle, (c) the most anterior point of the condyle, and (d) the most posterior point of the condyle. (C) Illustration of the method for locating the region of interest (ROI) for micro-CT analysis. The surface of the condylar head was equally divided into 3 parts, and the ROIs were located at the center of the middle and posterior parts.

