
Figure 2.
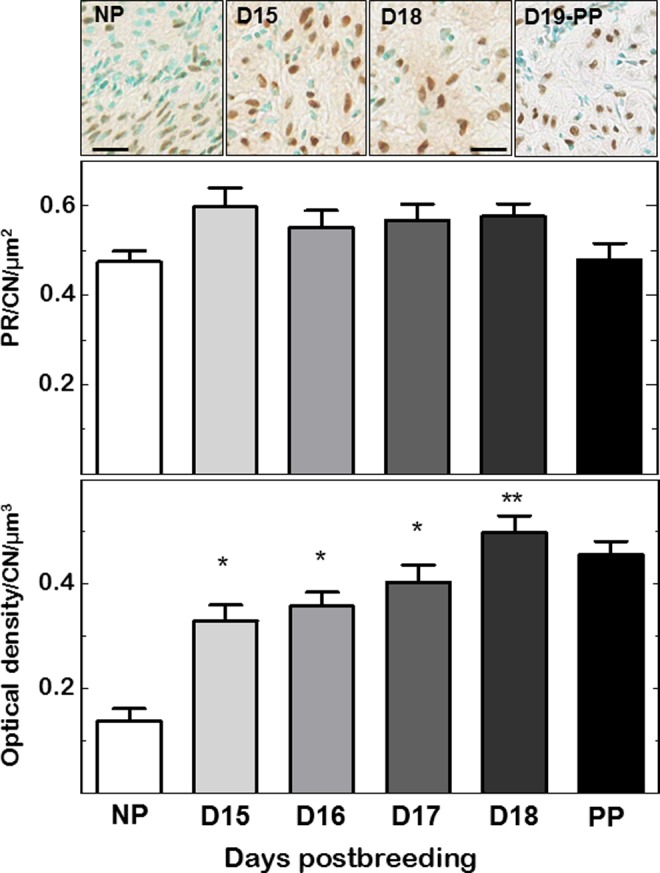
Top: Photomicrographs of progesterone receptor (PR) stained cells and counterstained cell nuclei (CN) in cervix sections from nonpregnant (NP), pregnant (days 15 and 18 postbreeding), and day of birth postpartum (PP) mice. Scale bar is 25 µm. Middle: Density of PR cells normalized to CN per area to account for variability in cell nuclei density due to heterogeneity of tissue morphology within and among sections in individuals, as well as within and among groups. Data are the mean ± SE (n = 5-21/group). Bottom: As inversely related to cross-linked collagen in the extracellular matrix,2 optical density of birefringence of picrosirius red-stained cervix sections cells was normalized to CN per area. Data are mean ± SE (n = 4-10/group; *P < .05 vs NP mice or **vs NP, day 15 and day 16 postbreeding groups by 1-way ANOVA). See Methods for details about staining and analyses. SE indicates standard error; ANOVA, analysis of variance.