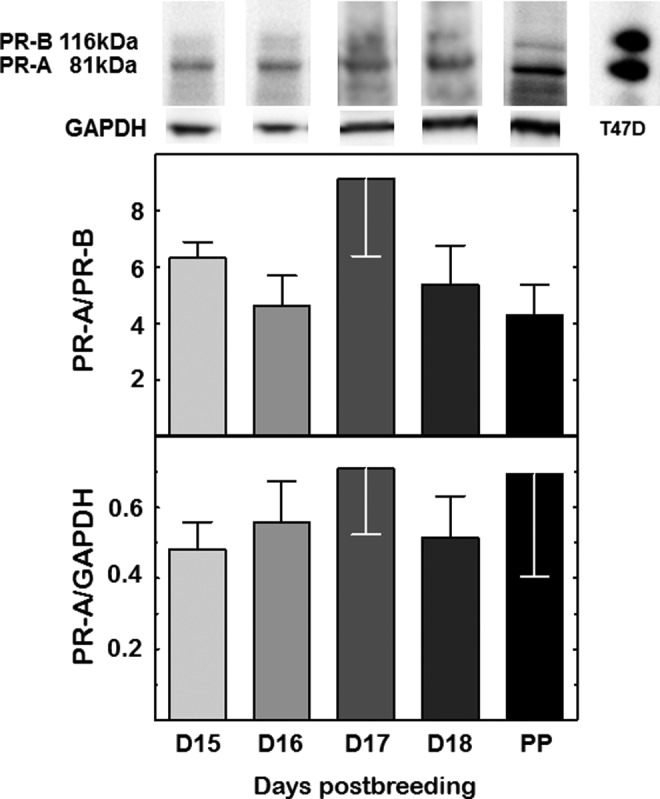
Figure 3.

Representative immunoblot of cervix protein extract from pregnant mice on postbreeding days 15 to 18 and the day of birth (PP). Histograms are the optical density of the PR-A-to-PR-B ratio or optical density of the PR-A band normalized to the GAPDH loading control. Data are the mean ± SE (n = 4/group, P > .05; 1-way ANOVA). See Methods for details. PR indicates progesterone receptor; SE, standard error; ANOVA, analysis of variance.
