-
A
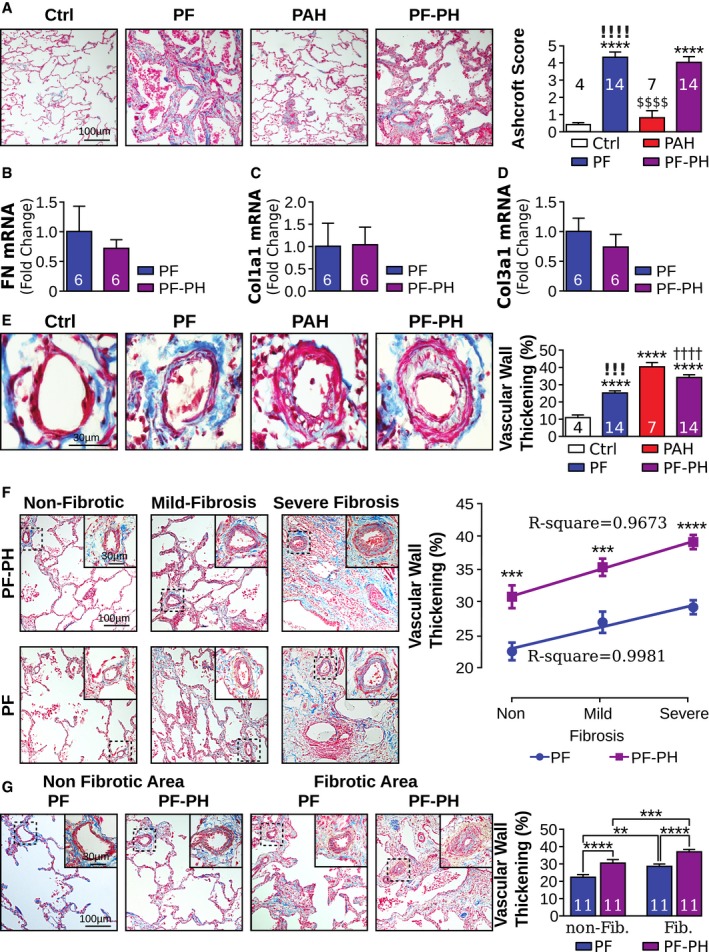
Masson's trichrome representative images of pulmonary fibrosis and quantification.
-
B–D
Relative transcript expression of (B) fibronectin, (C) collagen I, and (D) collagen III to GAPDH.
-
E
Masson's trichrome representative images of vascular wall thickening and quantification.
-
F
Masson's trichrome representative images and correlation between lung fibrosis and vascular wall thickness in PF and PF‐PH patients. Out of the 14 PF and PF‐PH patients, 3 of them had no non‐fibrotic area and therefore were excluded for comparison between non‐fibrotic and fibrotic areas (n = 11/group; Ashcroft score non‐fibrosis: 0–2; mild fibrosis: 3–5; severe fibrosis > 5) (* compared to non‐fibrotic areas of the same group of patients).
-
G
Masson's trichrome representative images of vascular wall thickening in non‐fibrotic area (Ashcroft score 0–2) and fibrotic area (Ashcroft score > 2) and quantification in PF and PF‐PH.
Data information: Values are expressed as mean ± SEM. The number of samples per group for each experiment is written within each bar graph. Statistical test: panels (A, E–G): ANOVA; panels (B–D):
t‐test (* versus Ctrl, † versus PF, ! versus PAH, $ versus PF‐PH; **
P < 0.01, ***
P < 0.001, ****
P < 0.0001,
††††
P < 0.0001,
!!!
P = 0.0001,
!!!!
P < 0.0001,
$$$$
P < 0.0001).

