-
A
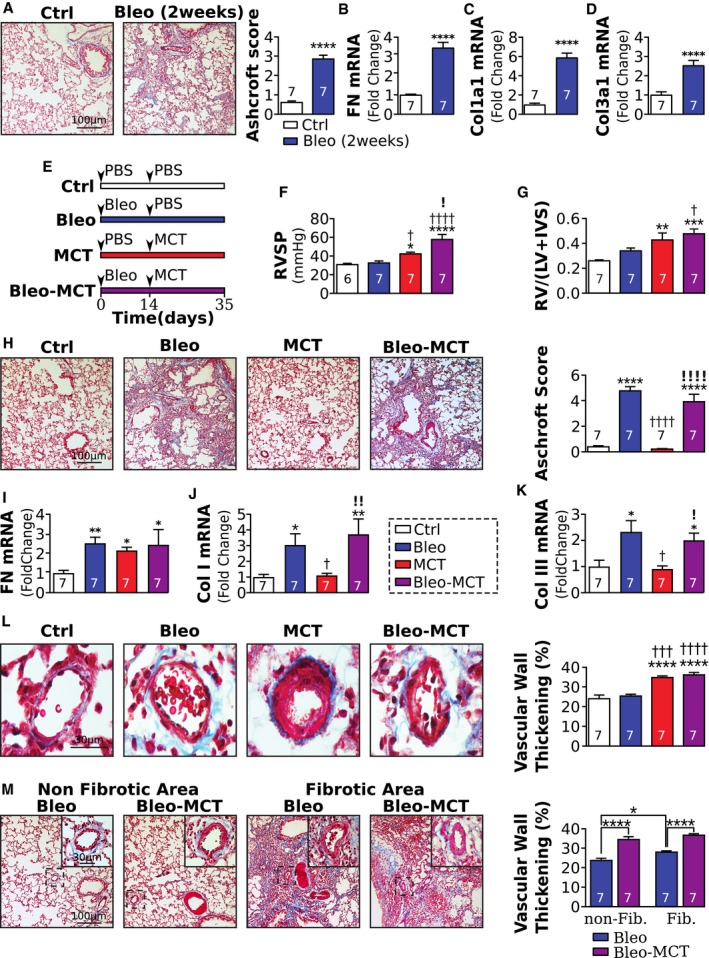
Masson's trichrome representative images of lung fibrosis and quantification 2 weeks after PBS or bleomycin instillation.
-
B–D
Quantification of (B) fibronectin, (C) collagen I, and (D) collagen III mRNA.
-
E
Schematic of experimental protocol. Animals were divided into 4 groups: control (Ctrl), pulmonary fibrosis (PF), pulmonary hypertension (PH), and PF secondary to PH (PF‐PH). At day 0, rats in the PF and PF‐PH groups received an intratracheal instillation of bleomycin (2.5 mg/kg), whereas the Ctrl and PH groups received a PBS instillation. At day 14, the PH and PF‐PH groups received a subcutaneous injection of monocrotaline (MCT, 60 mg/kg), whereas the Ctrl and PF groups received a subcutaneous injection of PBS.
-
F, G
(F) Right ventricular systolic pressure (RVSP) and (G) right ventricular hypertrophy index following the experimental protocol.
-
H
Masson's trichrome representative images and quantification of Ashcroft score in the experimental model.
-
I–K
Relative expression of fibronectin (I), collagen I (J), and collagen III (K) mRNA normalized to GAPDH.
-
L
Masson's trichrome representative images and quantification of vascular remodeling.
-
M
Masson's trichrome representative images and quantification of the vascular remodeling between fibrotic and non‐fibrotic areas in the experimental model.
Data information: Values are expressed as mean ± SEM. The number of samples per group for each experiment is included within each bar graph. Statistical test: panels (A–D) :
< 0.001.
< 0.0001).

