-
A
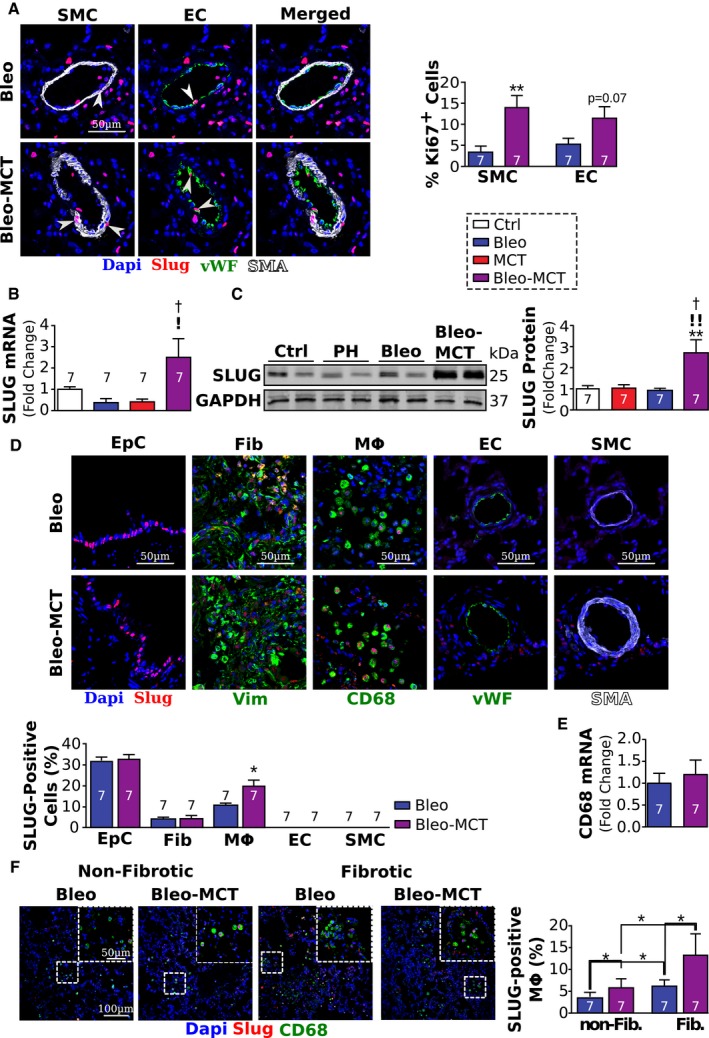
Representative images and quantification of Ki67‐positive (red) pulmonary vascular endothelial cells (EC, vWF in green) and smooth muscle cells (SMC) in the experimental model (* versus Bleo, **P < 0.01).
-
B, C
Relative expression of Slug mRNA (B) and protein (C) normalized to GAPDH.
-
D
Representative images of Slug (red) expression in bronchial epithelial cells (EpC), fibroblasts (Fib, vimentin in green), macrophages (Mф, CD68 in green), pulmonary vascular endothelial cells (EC, vWF), and smooth muscle cells (SMC, aSMA in white); and quantification (below) (* versus Bleo, P < 0.05).
-
E
CD68 mRNA quantification.
-
F
Representative images of Slug (red) expression in macrophages (Mф, CD68 in green) in non‐fibrotic and fibrotic areas of the lung in Bleo and Bleo‐MCT rats and quantification.
Data information: Values are expressed as mean ± SEM. The number of samples per group for each experiment is included within each bar graph. Statistical test: panels (A, D, and E):
t‐test; panels (B, C, and F): ANOVA (* versus Ctrl, † versus PF, ! versus PH; *
P < 0.05, **
P < 0.01,
†
P < 0.05,
!
P < 0.05,
!!
P < 0.01).

