-
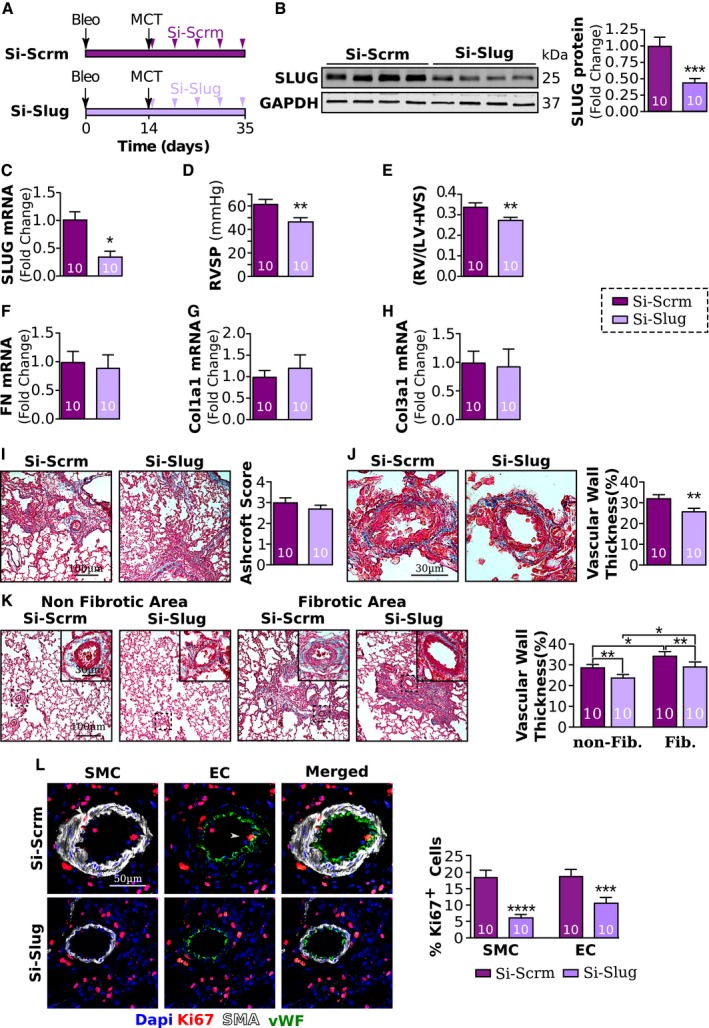
A
Experimental schematic of the prevention protocol. All rats received bleomycin at day 0 and MCT at day 14. Starting at day 17, rats received five intratracheal nebulizations (twice a week for 3 weeks) of either a small interfering RNA (siRNA) directed against Slug (Si‐Slug) or scramble siRNA (Si‐Scrm).
-
B, C
Relative expression of Slug protein (B) and mRNA (C) normalized to GAPDH.
-
D, E
Right ventricular systolic pressure (RVSP) and (E) right ventricular hypertrophy index in PF‐PH rats treated with Si‐Slug compared to Si‐Scrm.
-
F–H
Relative expression of fibronectin (F), collagen I (G), and collagen III (H) normalized to GAPDH.
-
I
Masson's trichrome representative images and quantification of the Ashcroft score.
-
J
Masson's trichrome representative images and quantification of vascular wall thickness.
-
K
Masson's trichrome representative images and quantification of the vascular remodeling between non‐fibrotic and fibrotic areas of the lung.
-
L
Representative images and quantification of Ki67‐positive (red) pulmonary vascular endothelial cells (EC, vWF in green) and smooth muscle cells (SMC, aSMA in white).
Data information: Values are expressed as mean ± SEM. The number of samples per group for each experiment is included within each bar graph. Statistical test: panels (B–J):
< 0.0001).

