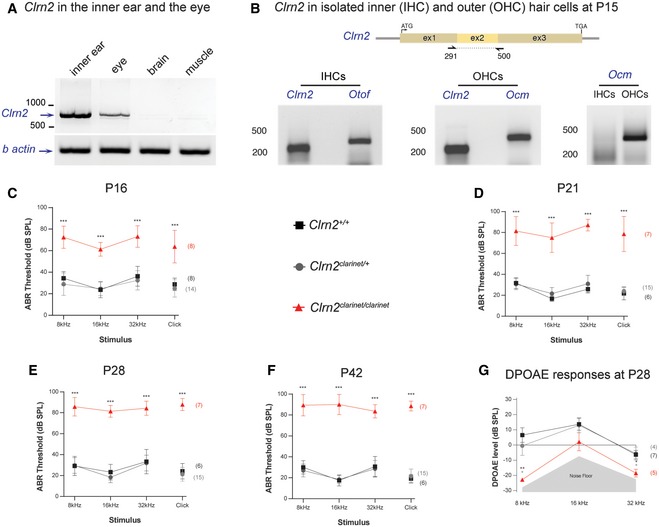
Figure 2. Clarin‐2 is required for hearing function.

-
ART–PCR analysis in P30 mice showing the presence of Clrn2 transcripts in the inner ear and eye, but not in brain or muscle. β‐actin was used as a positive control.
-
BClrn2 transcripts could be detected in both inner (IHCs) and outer (OHCs) hair cells of P15 wild‐type mice. Otoferlin (Otof) and oncomodulin (Ocm) transcripts were used as positive controls for IHCs and OHCs, respectively. Ocm transcripts were only present in the OHC lysate, demonstrating that the IHC sample had not been contaminated with OHCs.
-
C–FAuditory phenotyping of clarinet mice at P16 (C), P21 (D), P28 (E) and P42 (F). ABR threshold measurements show that Clrn2 clarinet/clarinet mice (red) exhibit a severe‐to‐profound hearing loss affecting all frequencies tested. At 16 kHz in Clrn2 clarinet/clarinet mice, the mean ABR hearing thresholds vary from 55–65 dB SPL at P16, 60–90 dB SPL at P21 and to 80–100 dB SPL at P28 and P42. Age‐matched Clrn2 +/+ (black) and Clrn2 clarinet/+ (grey) controls display thresholds within the expected range (15–45 dB SPL) at all frequencies and timepoints tested. At P16, all eight Clrn2 clarinet/clarinet mice exhibited recordable ABR responses for each frequency tested and the click stimulus. For the longitudinal ABR study, at P21 and P28 three of the seven Clrn2 clarinet/clarinet mice were found to not respond at the highest intensity stimulus (90 dB SPL) for at least one frequency‐specific/click stimulus. By P42, five of the Clrn2 clarinet/clarinet mice were found to not respond at the highest intensity stimulus (90 dB SPL) for at least two frequency‐specific/click stimuli. ABR data shown are mean ± SD ***P < 0.001, one‐way ANOVA.
-
GAveraged DPOAE responses for clarinet mice at P28, showing significantly reduced responses in Clrn2 clarinet/clarinet mutants at all frequencies tested. DPOAE data shown are mean ± SD. *P < 0.02, **P < 0.01, one‐way ANOVA. Please see Appendix Table S1 for exact P‐values.
