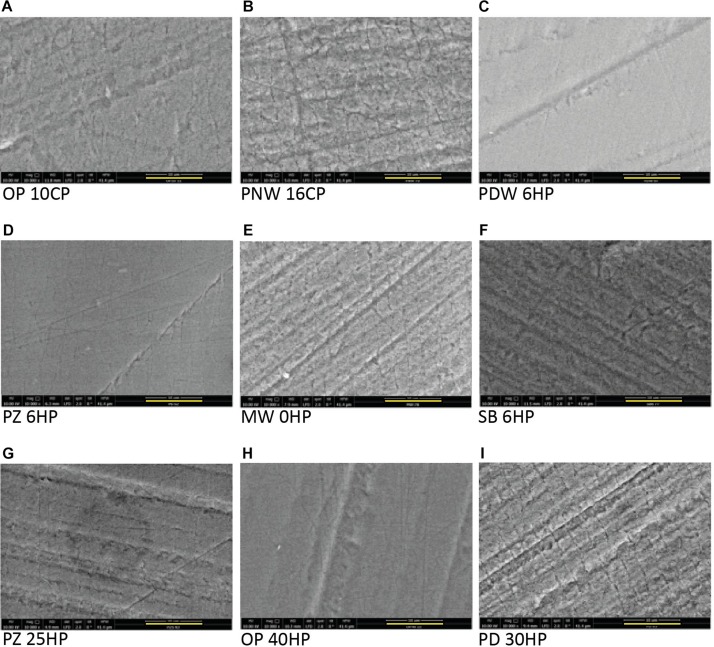
FIGURE 4.
Scanning electron microscope micrographs of all tested products after the bleaching procedure showing a base roughness of all specimens due to the grinding procedure. All micrographs are illustrated in 10 000 fold magnification (the yellow bar represents 10 μm). (A) Opalescence® PF 10%, OP 10CP. (B) Philips ZOOM®! NiteWhite® 16%, PNW 16CP. (C) Philips ZOOM®! DayWhite® 6%, PDW 6HP. (D) Philips ZOOM®! 6%, PZ 6HP. (E) Magic White® 0%, MW 0HP. (F) Smartbleach® 6%, SB 6HP. (G) Philips ZOOM®! 25%, PZ 25HP. (H) Opalescence® Boost 40%, OP 40HP. (I) Philips Dash 30%, PD 30HP.

