FIGURE 7.
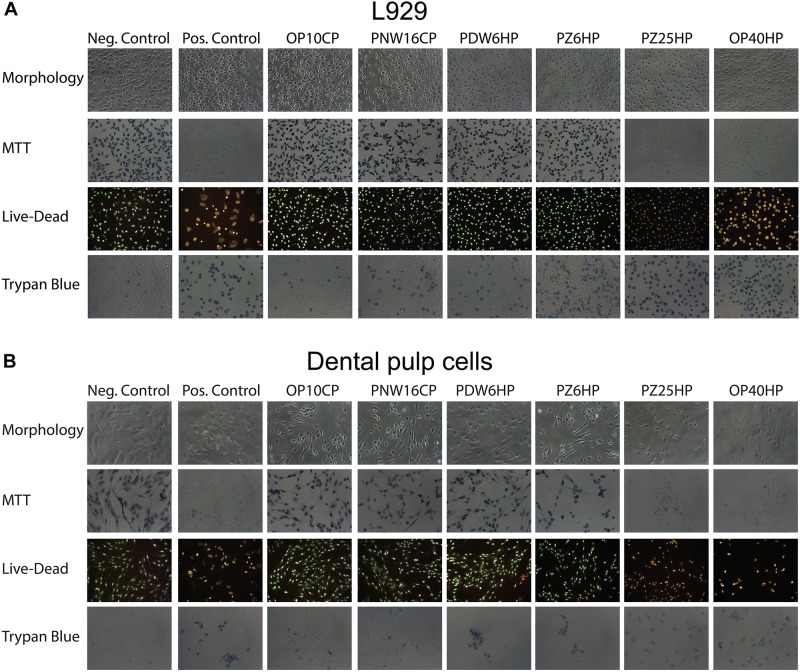
Cell morphology and the micrographs of L929 cells (A) and dental pulp cells (B) after adding MTT, performing Live-Dead staining and adding Trypan blue after incubation of the cells with 1%w/v of Opalescence® PF 10%, Philips ZOOM®! NiteWhite® 16%, Philips ZOOM®! DayWhite® 6%, Philips ZOOM®! 6%, Philips ZOOM®! 25%, and Opalescence® Boost 40%. Untreated cells and cells after adding 6% H2O2 served as negative and positive control, respectively.

