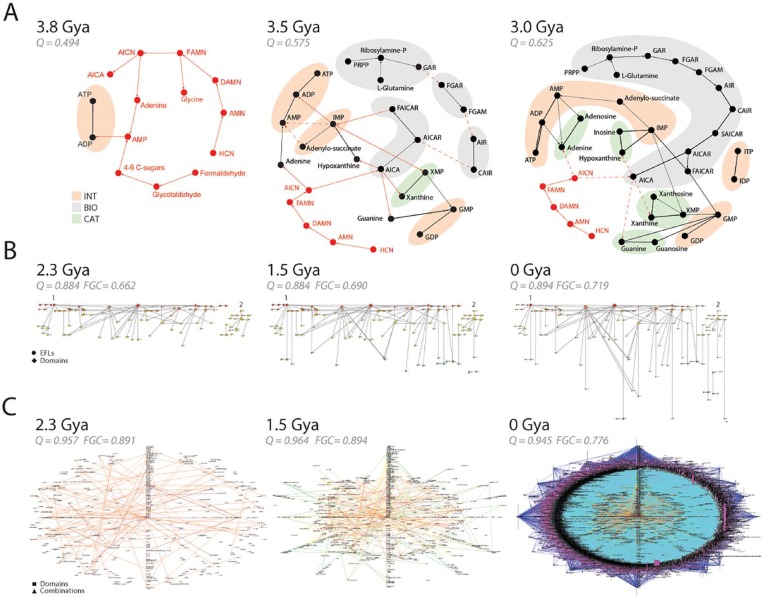
Figure 7.
Emergence of modularity in biological networks. (A) Early evolution of the purine metabolic network. The reconstruction of metabolic subnetworks that were present 3.8, 3.5, and 3 Gya reveal the piecemeal recruitment of functional modules for the nucleotide interconversion (INT), catabolism and salvage (CAT), and biosynthetic (BIO) pathways. Plausible metabolites and prebiotic chemical reactions supporting the emergent enzymatic reactions are depicted with red nodes and connections, respectively. Unknown reaction candidates or withering prebiotic pathways are indicated with dashed lines. These ancient chemistries are gradually replaced by modern pathways and are unified from separate components into a cohesive network of INT, CAT, and BIO modules. The network was rendered using the energy spring embedders and the Fruchterman-Reingold algorithm78 of Pajek.103 Full metabolite names can be found in the work by Caetano-Anollés and Caetano-Anollés.99 (B) The emergence of the elementary functionome (EF) network that connects protein structural domains to elementary functional loops (EFLs) when these substructures are embedded in protein structure. Bipartite networks are rendered as waterfall diagrams (see Figure 8), with time flowing from top to bottom. The first “p-loop” and second “winged helix” waves of recruitment are indicated with numbers. Data are from Aziz et al.32 (C) Evolution of networks of protein domain organization. The combination of structural domains in multidomain proteins induces connectivity between nodes representing domain and domain combinations in the network when a domain is present in a structure. As networks grow, older nodes are placed in the middle of radial graphs. Note how the “big bang” of domain combinations occurring 1.23 Gya during the rise of diversified organismal lineages results in a massive graph. Evolutionary data and networks from Wang and Caetano-Anollés113 and Aziz and Caetano-Anollés.104 Protein ages were derived from phylogenomic trees describing the evolution of domains at fold family (FF) (panel A) and fold superfamily (FSF) (panels B and C) levels. Panels B and C describe networks present 2.3, 1.5, and 0 Gya during culmination of the architectural, superkingdom specification, and organismal diversification epoch of the protein world, respectively. Modularity (Q) measures connectivity density in node communities and Fast Greedy Community (FGC) measures community structure. In all cases, Q and FGC significantly increase in evolution much earlier than 2.3 Gya and then reach a plateau and decrease.

