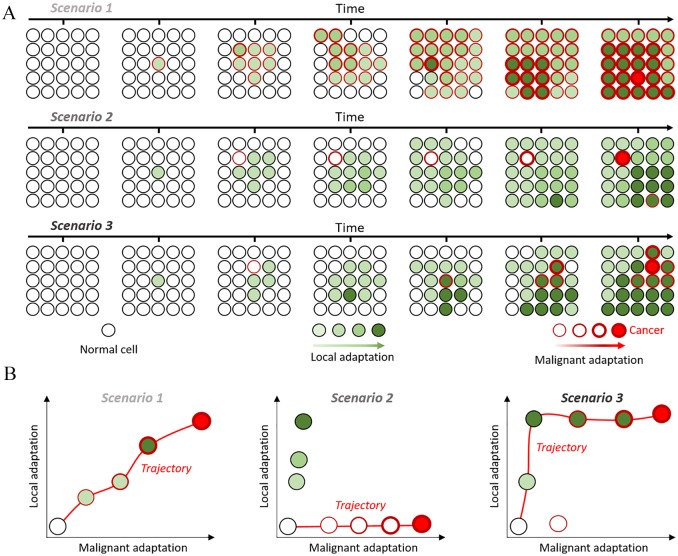
Figure 2.
Uncoupling local and malignant adaptation: (A) growth of a finite population over time under 3 different scenarios. Cells acquire alterations that differently affect their adaptation (green fill) and probability to become cancerous (red outline). (B) Distribution of local and malignant adaptation scores for each clone and the trajectories leading from normal to cancer in red.

