Figure 1.
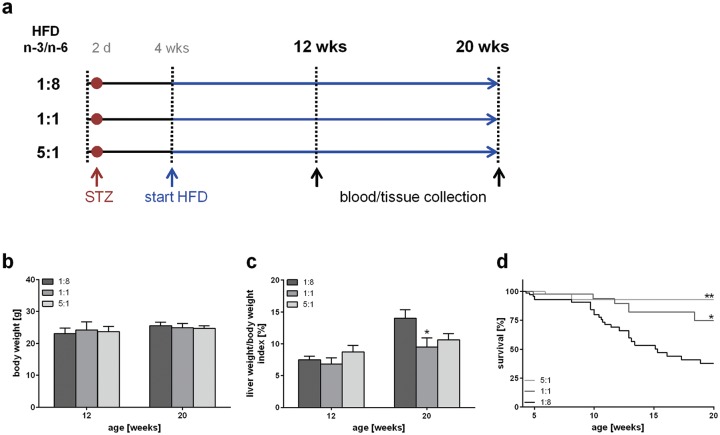
Experimental design and evaluation of general disease parameters. (a) Experimental design of mice treated with STZ and HFD, differing in n-3 and n-6 PUFA contents and ratios (n-3/n-6: 1:8, 1:1, 5:1). Body weight (b) and liver/body weight index (c) of STZ/HFD-treated mice fed HFDs differing in n-3/n-6 PUFA ratios (1:8, 1:1 and 5:1) (n = 10–12 per group). Values are given as mean ± SEM. Differences between the groups were assessed by two-way ANOVA followed by Tukey’s range test within each time point. *p < 0.05 versus 1:8 fed mice, **p < 0.01 versus 1:8 fed mice. (d) Survival of STZ/HFD-treated mice fed HFDs differing in n-3/n-6 PUFA ratios (1:8, 1:1 and 5:1). Survival curves were created using the product limit method of Kaplan and Meier, and statistical analysis was performed using log-rank test and Bonferroni correction. *p < 0.05 (Bonferroni corrected p < 0.01667) versus 1:8 fed mice (HR: 0.375, 95 % CI; 0.182–0.776), **p < 0.01 (Bonferroni corrected p < 0.0033) versus 1:8 fed mice (HR: 0.129, 95 % CI; 0.129–0.608).
HFD, high-fat diet; PUFA, polyunsaturated fatty acid; SEM, standard error of the mean; STZ, streptozotocin.

