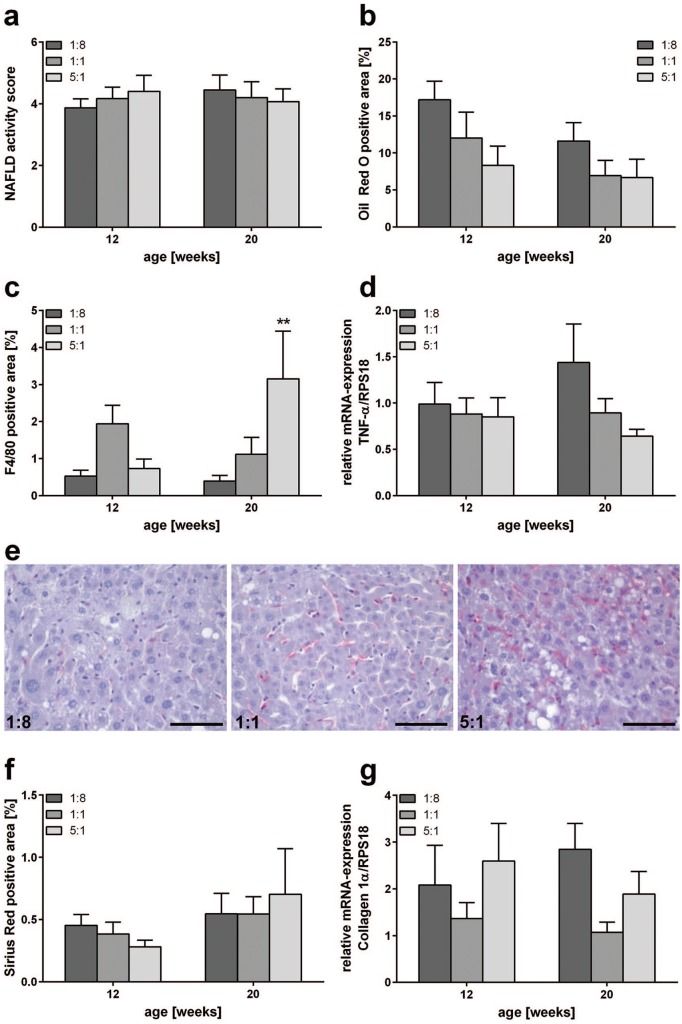
Figure 4.
Assessment of NAFLD progression, inflammation and fibrosis. (a) NAFLD activity score of STZ/HFD-treated mice fed HFDs differing in n-3/n-6 PUFA ratios (1:8, 1:1 and 5:1) (n = 10–12 per group). Histomorphometric quantification of Oil Red O (b), F4/80 (c), and Sirius red (f)-stained liver sections of STZ/HFD-treated mice fed HFDs differing in n-3/n-6 PUFA ratios (1:8, 1:1 and 5:1) (n = 8–12 per group). Values are given as mean ± SEM. Differences between the groups were assessed by two-way ANOVA followed by Tukey’s range test within each time point. **p < 0.01 versus 1:8 fed mice. Quantitative RT-PCR analysis of hepatic TNF-α (d) and Collagen 1α (g) expression of STZ/HFD-treated mice receiving HFDs differing in n-3/n-6 PUFA ratios (1:8, 1:1 and 5:1) (n = 10–12 per group). Values are given as mean ± SEM. Differences between the groups were assessed by two-way ANOVA followed by Tukey’s range test within each time point. **p < 0.01 versus 1:8 fed mice. (e) Representative photomicrographs of F4/80 stained liver sections of 20-week-old STZ/HFD-treated mice receiving HFDs with n-3/n-6 PUFA ratios of 1:8, 1:1 and 5:1, respectively. Scale bar represents 50 µm.
HFD, high-fat diet; NAFLD, nonalcoholic fatty liver disease; RT-PCD, reverse transcriptase-polymerase chain reaction; SEM, standard error of the mean; STZ, streptozotocin; TNF-α, tumor necrosis factor-α.

