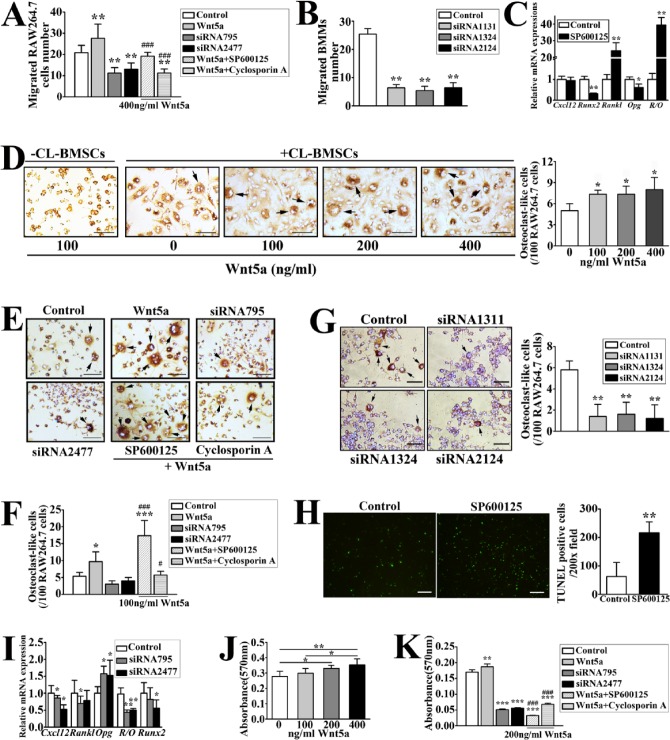
Figure 4.
Wnt5a-induced signaling responses in the bone marrow stromal cell line (CL-BMSCs) promoted migration and differentiation of RAW264.7 cells in co-cultures and strengthened mineralization of CL-BMSCs. (A) Migration of RAW264.7 cells (4 × 10³ cells/well) in co-cultures with CL-BMSCs (2.5 × 10⁴/well), which were preincubated with control or Ror2 small interfering RNA (siRNA) (siRNA795 or siRNA 2477; 20 pmol/5 × 104 cells) in transwell plates in the absence or presence of Wnt5a (400 ng/mL) with or without SP600125 (10 µM) or cyclosporine A (1 µM), was assessed. Power = 0.64, 0.94, 0.90 (Wnt5a, siRNA795, and siRNA2477 vs. control, respectively) and 0.8, 0.94 (SP600125 and cyclosporine A vs. Wnt5a, respectively). (B) Migration of bone marrow macrophages (BMMs) (4 × 10³ cells/well) in co-cultures with UAC-treated BMSCs (2.5 × 10⁴/well), which were preincubated with control or Ror2 siRNA (siRNA1131, siRNA1324, or siRNA 2124; 20 pmol/5 × 104 cells), was assessed. Power = 0.98. (C) CL-BMSCs were incubated with 10 µM SP600125 for 24 h. Real-time polymerase chain reaction (PCR) analysis was performed to detect the messenger RNA expressions of Cxcl12, Runx2, Rankl, Opg, and the ratio of Rankl to Opg (R/O) in CL-BMSCs. Power = 0.78 (Runx2), 0.77 (Rankl), 0.64 (Opg), and 0.88 (R/O). (D) Images and quantifications of tartrate-resistant acid phosphatase staining (TRAP)–positive osteoclasts (black arrows) in the co-cultures of CL-BMSCs and RAW264.7 cells were obtained 10 d after they were cultured with various concentrations of Wnt5a (0 to 400 ng/mL). Bars = 40 µm. No multinucleated osteoclasts were found in cultures of RAW264.7 cells without CL-BMSCs but with 100 ng/mL Wnt5a. Power = 0.90, 0.86, and 0.56 (100, 200, and 400 vs. 0, respectively). (E) Images and (F) quantifications of TRAP-positive osteoclasts (black arrows) in the co-cultures of CL-BMSCs pretreated with control or Ror2 siRNA (siRNA795 or siRNA 2477; 20 pmol/5 × 104 cells) and RAW264.7 cells were assessed 10 d after they were treated in the absence or presence of Wnt5a (100 ng/mL) and SP600125 (10 µM) or cyclosporine A (1 µM). Bars = 40 µm. Power = 0.84 (Wnt5a vs. control), 0.84, and 0.83 (SP600125 and cyclosporine A vs. Wnt5a). (G) Images and quantifications of TRAP-positive osteoclasts (black arrows) in the co-cultures of UAC-treated BMSCs pretreated with control or Ror2 siRNA (siRNA1131, siRNA1324, or siRNA 2124; 20 pmol/5 × 104 cells) and RAW264.7 cells. Bars = 40 µm. Power = 0.98. (H) Image and calculation of terminal deoxynucleotidyl transferase dUTP nick end labeling (TUNEL)–positive cells per 200× field. RAW264.7 cells were incubated with 10 µM SP600125 for 7 d. TUNEL assay was performed to determine the apoptosis of osteoclast precursors. Bars = 50 µm. Power = 0.96. (I) Quantitative PCR was performed on RNAs extracted from CL-BMSCs pretreated with control or Ror2 siRNA (siRNA795 or siRNA 2477; 20 pmol/5 × 104 cells) to assess changes in the expressions of Cxcl12, Rankl, Opg, and Runx2 messenger RNA and the Rankl/Opg ratio (R/O) in the cells. Power = 0.23, 0.6 (Cxcl12 siRNA795 and siRNA 2477); 0.28 (Rankl siRNA795); 0.6, 0.42 (Opg siRNA795 and siRNA 2477); 0.7, 0.7 (Rankl/Opg siRNA795 and siRNA 2477); and 0.42 (Runx2 siRNA 2477). (J) Matrix mineralization of CL-BMSCs was analyzed by Alizarin red staining after the cells were cultured in osteogenic induction medium (OIM) with various concentrations (0 to 400 ng/mL) of Wnt5a for 2 wk. Power = 0.58, 0.68 (200 and 400 vs. 0, respectively). (K) Matrix mineralization of CL-BMSCs, which were pretreated with control or Ror2 siRNA (siRNA795 or siRNA 2477; 20 pmol/5 × 104 cells) and cultured in OIM containing Wnt5a (200 ng/mL) in the absence or presence of SP600125 (10 µM) or cyclosporine A (1 µM) for 2 wk, was determined by Alizarin red. Power = 0.60, 0.75, 0.80 (Wnt5a, siRNA795, and siRNA2477 vs. control, respectively); 0.83, 0.81 (SP600125 and cyclosporine A vs. Wnt5a). Data are presented as means ± SD. *P < 0.05, **P < 0.01, ***P < 0.001 vs. control; #P < 0.05, ###P < 0.001 vs. Wnt5a group.

