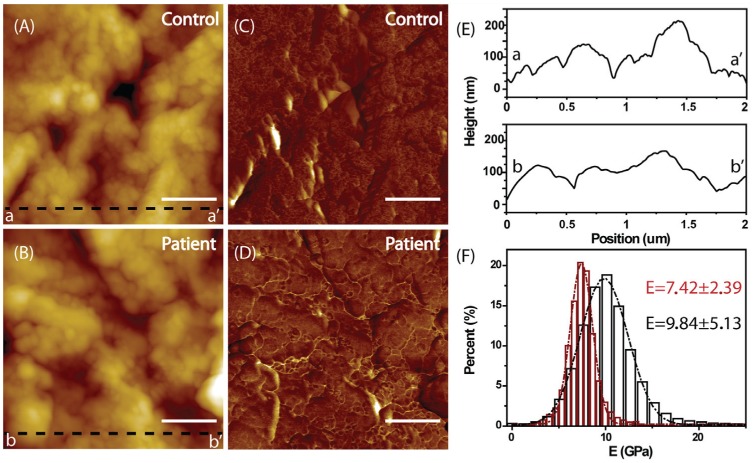
Figure 5.
Atomic force microscopy analysis. The topography and Young’s modulus of the healthy control’s (A, C) and the patient’s (B, D) cementum, respectively. The scale bar is 500 nm. (E) The line profiles corresponding to the dark dash lines aa′ (A) and bb′ (B). It is evident that the line profile bb′ (the patient’s) is much smoother than aa′ (the healthy control’s). (F) The corresponding Young’s modulus distributions of healthy (dark) and the patient’s cementum (red). The Young’s modulus distribution for the patient’s cementum is much narrower (7.42 ± 2.39 vs. 9.84 ± 5.13 GPa, P < 0.05), indicating the disease-associated softness of the cementum.

