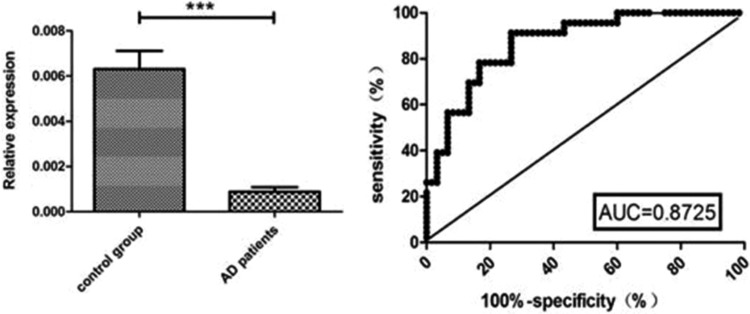
Fig. 2.
The concentration of miRNA-101a in AD and control groups. The left panel shows the relative expressions of miRNA-101a. The relative expression of miRNA-101a was significantly downregulated in the AD group compared with the control group (p < 0.01). The right panel shows the ROC curve.
AD: Alzheimer’s disease; miRNA: microRNA; ROC: receiver operating characteristic.

