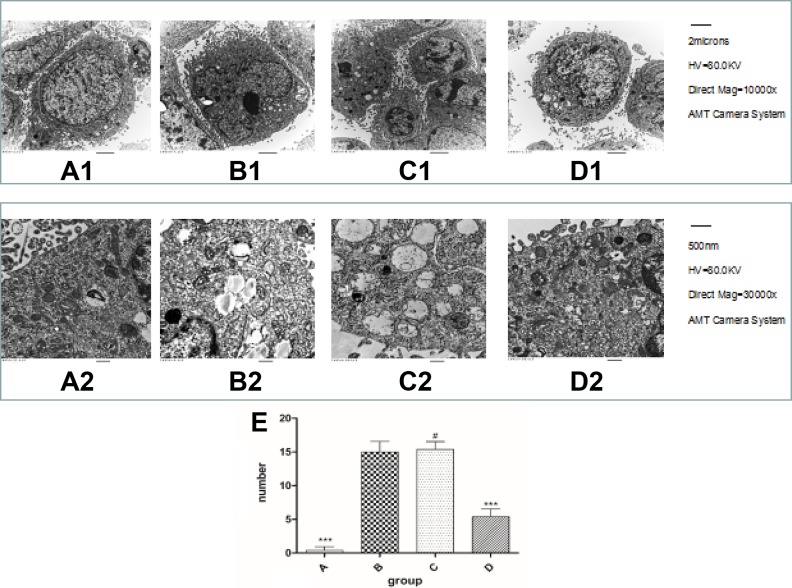
Fig. 4.
The formation of autophagy bubbles revealed by transmission electron microscopy. A1–D1 ×10,000; A2–D2 ×30,000. A1 and A2 are SH-SY5Y cells. They showed abundant and normal morphology of cytoplasm, cell organelles and nuclei. B1 and B2 were from the AD model cells. There were abundant autophagic vacuoles and lysosomes. C1 and C2 were from the negative control group; the autophagic vacuoles are similar to the AD cell model. After transfection with miRNA-101a, the autophagic vacuoles and lysosomes numbered fewer than the AD model cells, D1 and D2.
AD: Alzheimer’s disease.

