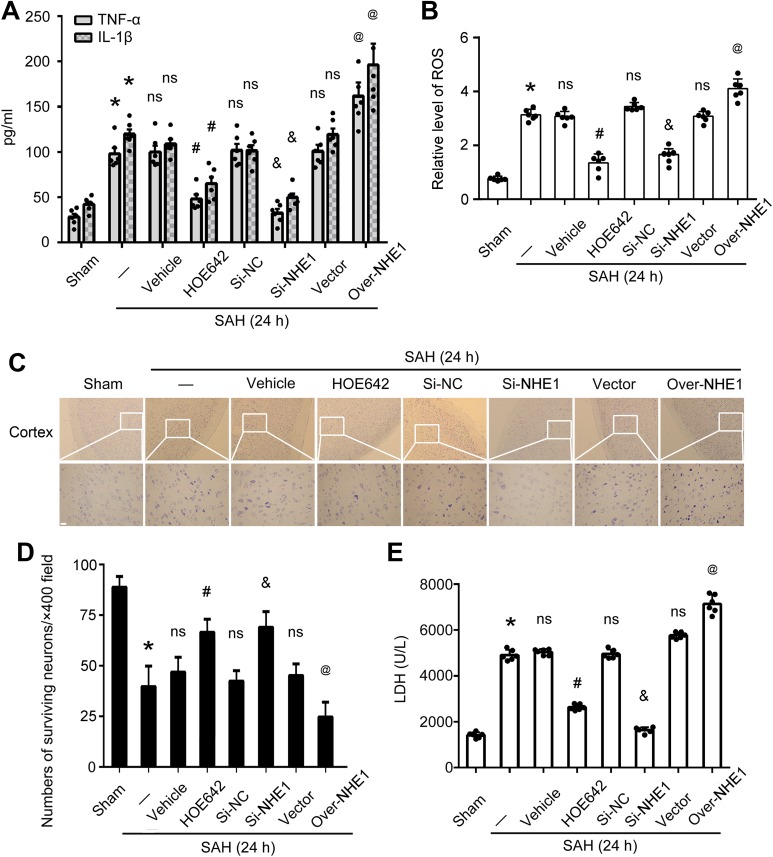
Fig. 6.
Roles of NHE1 in EBI induced by SAH in vivo. Concentrations of TNF-α (A) and IL-1β (A) in cerebro-spinal fluid (CSF) of rats at various groups are shown. (B) Relative levels of reactive oxygen species (ROS) in brain tissues of rats at various groups. Mean values of Sham group are normalized to 1.0. (C) Nissl staining shows surviving neurons in the cortex of rats in each group. Scale bar = 20 μm. (D) Quantification of surviving neurons per ×400 field in the cortex of rats in various groups. (E) Relative levels of lactate dehydrogenase (LDH) in CSF of rats at various groups. Mean values of Sham group are normalized to 1.0. In (A), (B), (D) and (E), all data are presented as mean ± SEM; *p < 0.05 vs. Sham group; ns, no significant difference vs. SAH group; # p < 0.05 vs. SAH + Vehicle group; & p < 0.05 vs. SAH + Si-NC group; @ p < 0.05 vs. SAH + Vector group; n = 6.

