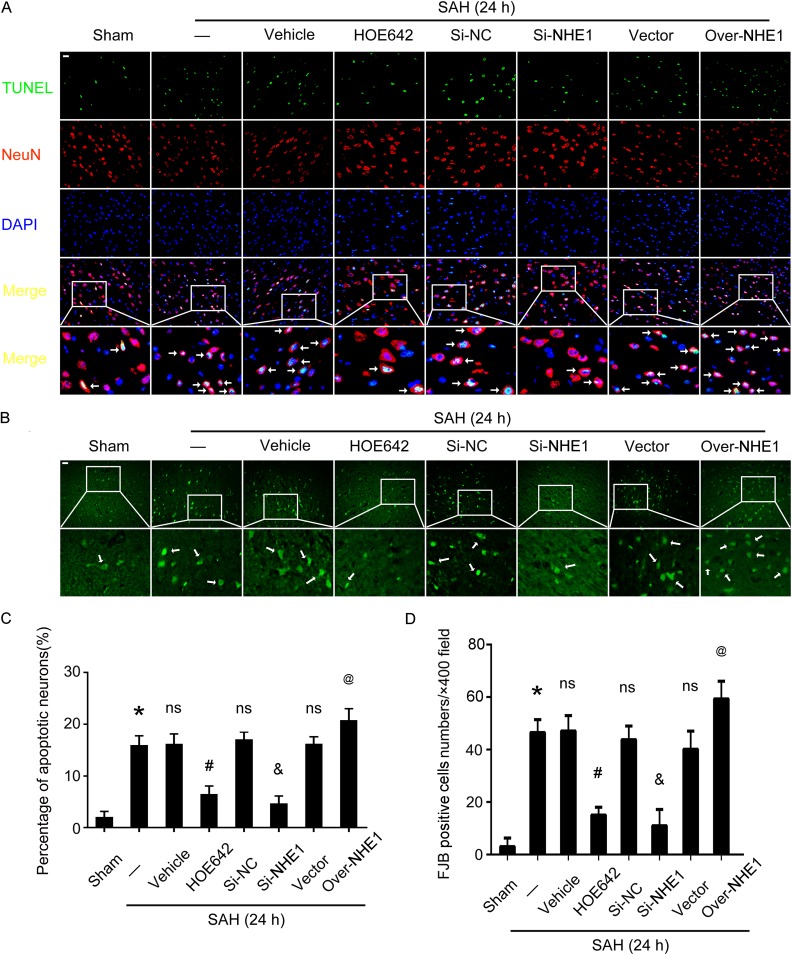
Fig. 8.
Roles of NHE1 in neuronal apoptosis and degeneration in brain tissues of rats following SAH. (A) Double immunofluorescence for NeuN (red) and TUNEL (green) is performed. Nuclei is fluorescently labeled by DAPI (blue). Arrows indicate apoptotic neurons (TUNEL- and NeuN- positive cells). Scale bar = 20 μm. (B) Fluoro-Jade B (FJB) staining (green) is performed to assess neuronal degeneration in all groups at 24 h after SAH. Scale bar = 20 μm. (C) Percentages of TUNEL-positive neurons are shown. (D) Quantitative analysis of FJB positive cells in brain sections of rats in each group. FJB-positive cells are counted per ×400 field. In (B) and (D), all data are shown as mean ± SEM; *p < 0.05 vs. Sham group; ns, no significant difference vs. SAH group; # p < 0.05 vs. SAH + Vehicle group; & p < 0.05 vs. SAH + Si-NC group; @ p < 0.05 vs. SAH + Vector group; n = 6.

