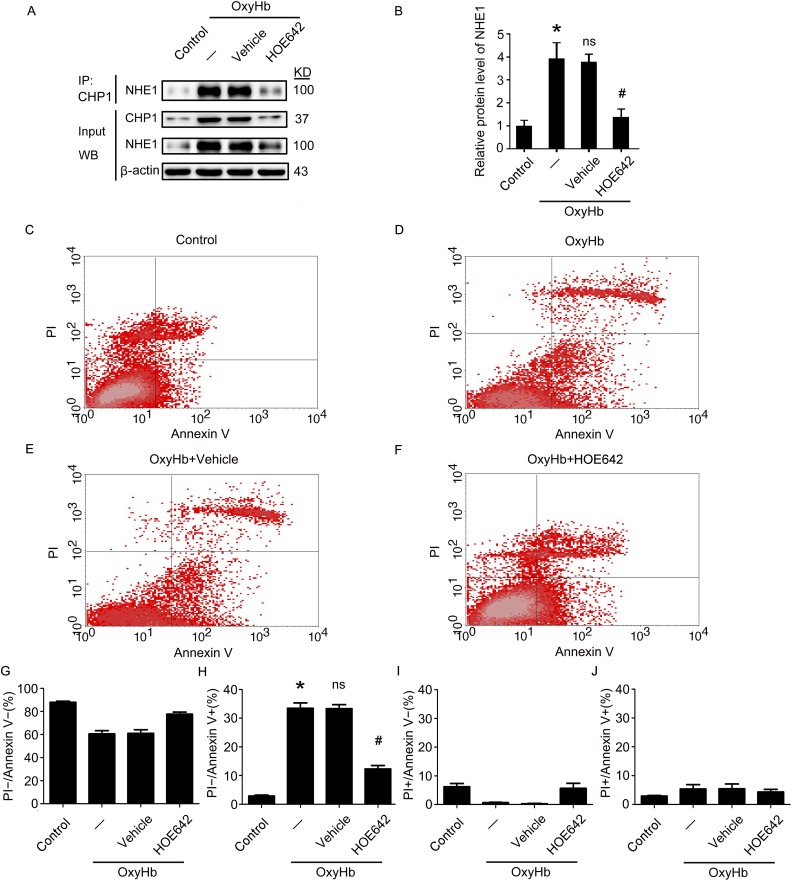
Fig. 9.
Effects of inhibition NHE1 by treatment with HOE642 in OxyHb-induced neuronal apoptosis in vitro. (A) The interaction of NHE1 and CHP1 in cultured neurons at 24 h after OxyHb treatment is tested by immunoprecipitation (IP) analysis. Input, 5% of extract before IP. (B) Quantification of protein levels of NHE1 interacted with CHP1 in neurons at 24 h after OxyHb treatment. (C–F) PI and Annexin V double staining and flow cytometry analysis show neuronal apoptosis in various groups in vitro. (G–J) Bar graphs describing the different conditions of neurons in various groups. (G) PI−/Annexin V− indicates surviving neurons. (H) PI−/Annexin V+ indicates apoptotic neurons. (I) PI+/Annexin V− indicates necrotic neurons. (J) PI+/Annexin V+ exhibits a mix damage of cells. In (G)–(J), all data are presented as mean ± SEM; *p < 0.05 vs. Control group; NS, no significant difference vs. OxyHb group; # p < 0.05 vs. OxyHb + Vehicle group, n = 3.

