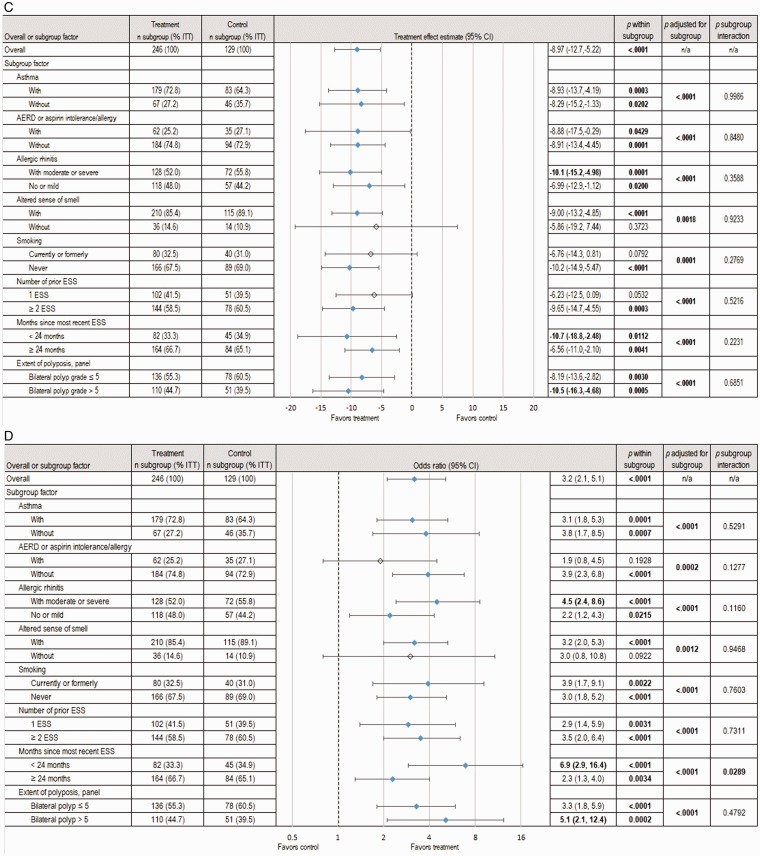
Figure 3.
Pooled analysis of subgroup factor effect on subjective and objective outcomes at day 90. The changes from baseline to day 90 in symptomatic and endoscopic outcomes across subgroups based on analysis of the pooled data from 2 RCTs, totaling 375 patients with NP grade ≥ 2 on each side at screening who were indicated for RESS, are shown. The treatment group underwent in-office bilateral placement of MF sinus implants, and the control group underwent a sham procedure. All patients (treatment and control) were required to use MFNS once daily. Summary statistics include estimates of the treatment effect (mean difference or odds ratio between treatment groups, 95% CI) within subgroups, the overall treatment effect when accounting for subgroups effect, and the interaction of treatment by subgroup. Subgroups representing <10% of ITT population were omitted. Treatment effects with P < .05 were considered statistically significant and are highlighted in bold font and with blue shaded diamonds. A, Change in NO/C score (scale 0–3, with higher scores indicating greater severity). B, Change in mean BPG (scale 0–8, with higher scores indicating greater severity), as determined based on a centralized blinded video-endoscopy review by an independent panel of 3 sinus surgeons. C, Change in ESO (VAS 0–100, with higher scores indicating greater severity), as determined by the independent panel. D, Proportion of patients still indicated for RESS. AERD, aspirin-exacerbated respiratory disease; CI, confidence interval; ESO, ethmoid sinus obstruction; ESS, endoscopic sinus surgery; ITT, intent-to-treat; MF, mometasone furoate; MFNS, MF nasal spray; n/a, not applicable; NO/C, nasal obstruction/congestion; NP, nasal polyps; RCT, randomized controlled trial; RESS, revision ESS; VAS = visual analog scale.


