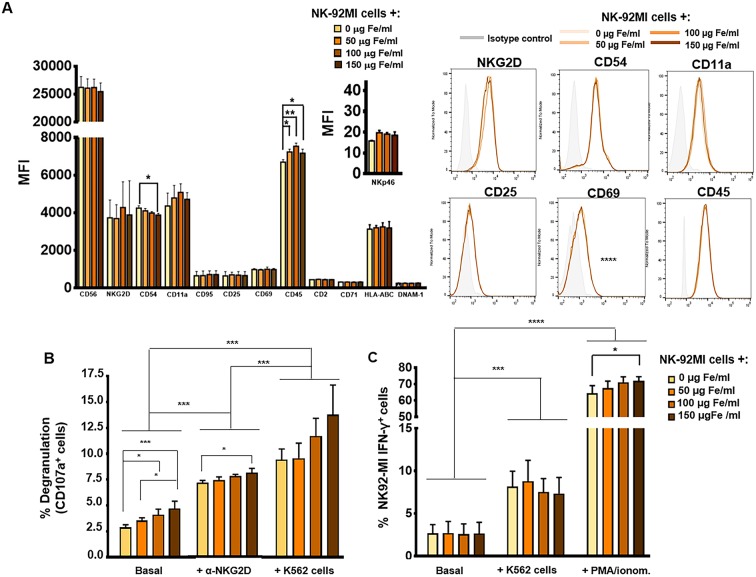
Figure 2.
Phenotypic and functional analysis of NK-92MI cells after their association with MNPs. (A) Quantification (MFI, mean fluorescence intensity) of the expression of relevant cell-surface markers in NK-92MI cells, after incubation with MNPs and representative histograms. (B) Degranulation capacity of NK-92MI cells, after being treated with different concentrations of MNPs and after exposure to a range of stimuli. (C) Quantification of the percentage of IFN-γ+ NK-92MI cells after MNP treatment and exposure to a number of stimuli. The data (mean ± SD) are representative of three independent experiments, *p < 0.05, **p < 0.01, ***p < 0.001, ****p < 0.0001.

