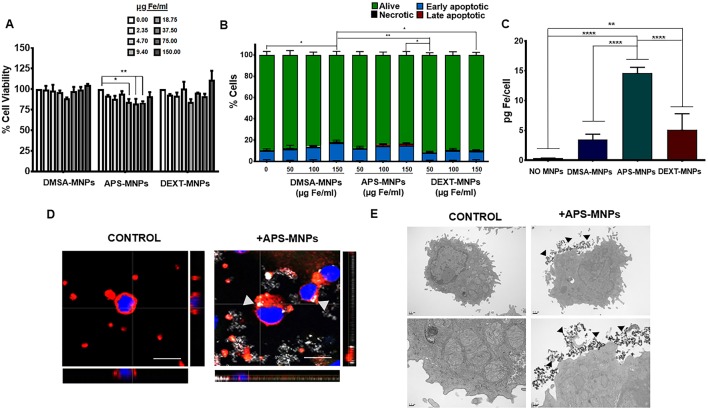
Figure 4.
Evaluation of MNP toxicity, quantification of MNP uptake and determination of subcellular location in murine NK cells. (A) Cell viability of murine NK cells after treatment with MNPs, measured by the AlamarBlue fluorometric test. (B) Analysis by flow cytometry of the percentage of apoptotic or necrotic murine NK cells after incubation with MNPs by Annexin V/PI staining. (Alive: Annexin V−/PI−; early apoptotic: Annexin V+/PI−; late apoptotic: Annexin V+/PI+ and necrotic: Annexin V−/PI+). (C) Quantification of the iron associated with the murine NK cells after incubation with the different MNPs, through ICP-OES. The results shown (mean ± SD) are representative of three independent experiments, *p < 0.05, **p < 0.01, ***p < 0.001, ****p < 0.0001. (D) Representative images of the murine NK cells after treatment with APS-MNPs acquired by confocal microscopy [cell membrane (red), NPMs (gray), and nucleus (blue)] (scale = 10 μm). The orthogonal projections were composed using ImageJ software. (E) Representative images obtained by TEM of murine NK cells after treatment with MNPs. The upper panels offer an overall view of the cell, while the lower panels depict cellular regions in greater detail to better illustrate the interactions between MNPs and the cell membrane.

