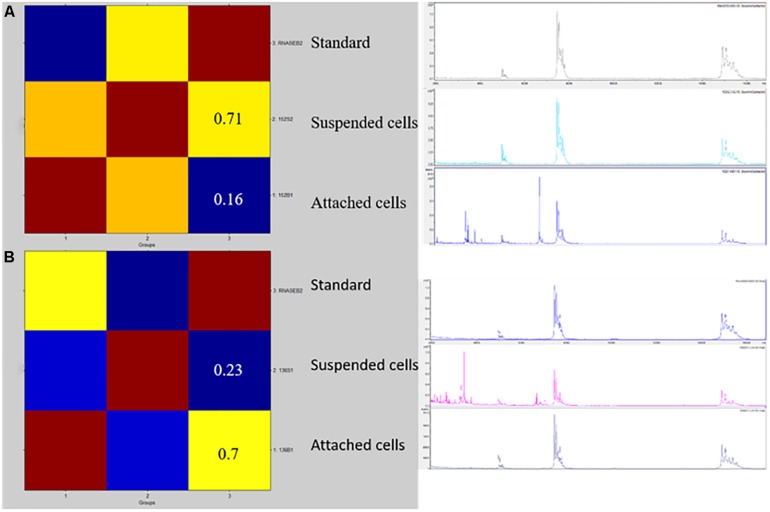
FIGURE 1.
A CCI matrix based visualization for two representative isolates of HP (A) and LP (B) C. parapsilosis. Reddish colors indicate a close relationship between the isolates’ mass spectrum profiles. The CCI values refer to the suspended or attached cell profiles matched against the RNase-B internal standard’s profile, respectively. The right picture shows the row spectra profiles of the internal standard and the suspended or attached isolates’ cells used to create the CCI matrix.

