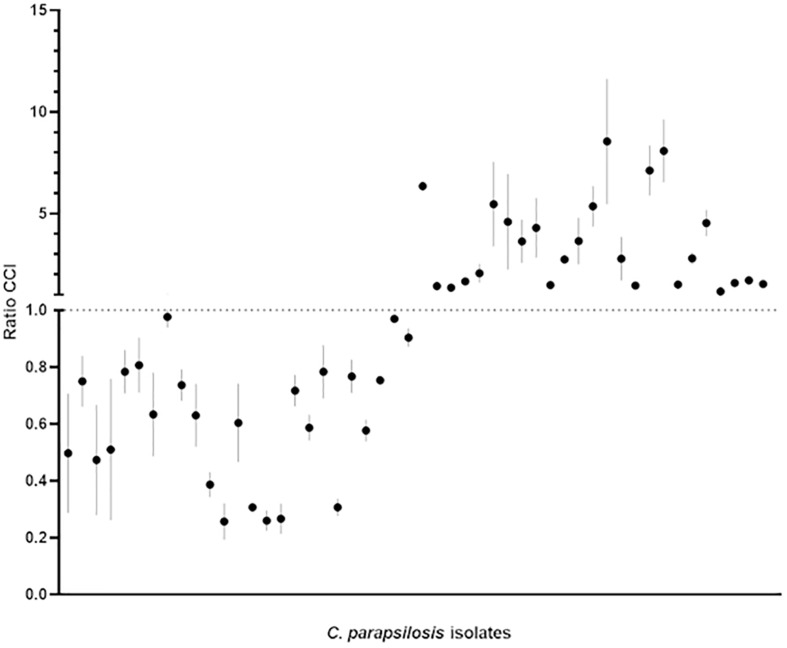
FIGURE 2.
Categorization of the 50 C. parapsilosis isolates (25 HP and 25 LP) included in the study based on the CCIsusp/CCIattach ratio (for details, see Supplementary Table S1). Bars indicate the minimum and maximum CCI ratio obtained for each of the three biological replicates of each isolate, with the mean value marked as a dark dot. According to the discriminatory power of the BIOF–HILO assay, the HP and LP isolates settled in the upper or the lower part of the plot, respectively.

