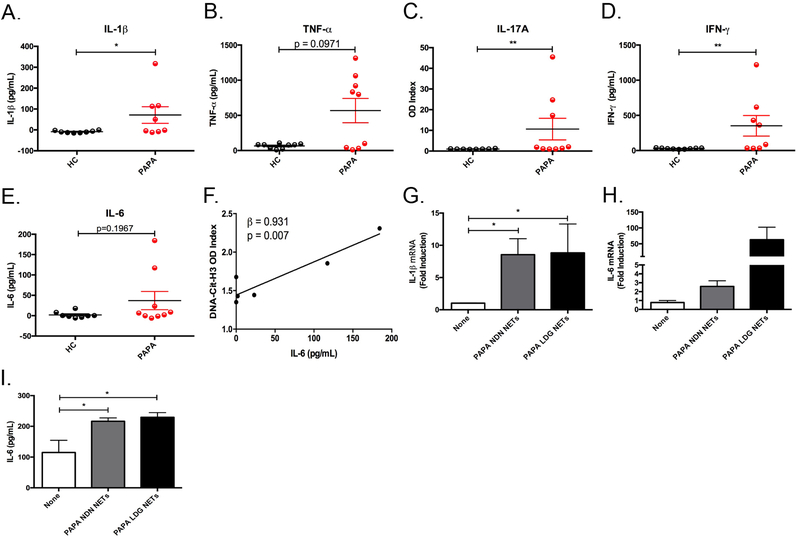
Fig. 5. Proinflammatory cytokines are elevated in PAPA serum.
(A-E) Serum concentrations of IL-1β, TNF-α, IFN-γ, and IL-6 (A, B, D, and E) and OD Index for IL-17A (C) in HC and PAPA subjects (n=9/group). Results represent mean ± SEM (*P ≤ 0.05; **P ≤ 0.01). (F) A linear regression analysis of the OD Index from citrullinated histone (H3)-DNA complexes in the plasma from PAPA subjects and IL-6 protein in PAPA sera (n=6). (G-I) HC macrophages were stimulated with spontaneously formed NETs from PAPA NDN or LDGs for 2 h (G and H) or 24 h (I). (G and H) Total RNA was isolated and qRT-PCR was performed to measure IL-1β and IL-6 gene expression; results represent mean ± SEM from four independent experiments (*P ≤ 0.05). (I) Culture supernatants were analyzed by ELISA for IL-6 protein and results represent the mean ± SEM from four independent experiments (*P ≤ 0.05).

