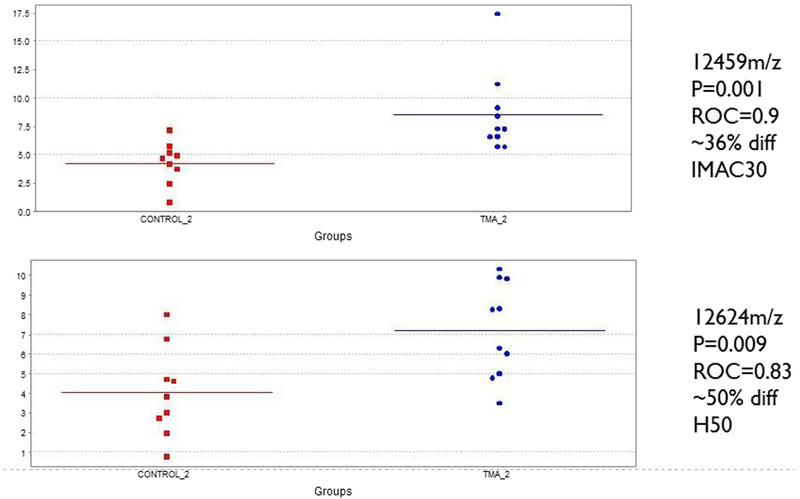
Fig. 1.
Peak intensities of differentially expressed protein species identified by SELDI-TOF in samples from ten patients with thrombotic microangiopathy (TMA) at pre-TMA time point. Results for control serum samples are shown in red and the pre-TMA samples in blue. Top panel, IMAC30 chip. Bottom panel H50 chip. Area under the receiveroperating characteristic (ROC) curve for prediction of TMA in pre-TMA samples

