


Figure 2.
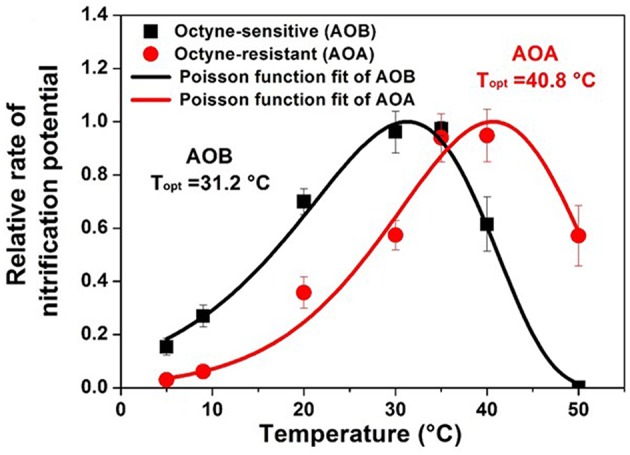
Temperature response of the relative potential nitrification rates for AOB (octyne-sensitive) and AOA (octyne-resistant) from a calcareous agricultural soil in Utah, USA. Rates are normalized to the fraction of maximum nitrification potentials at optimum temperature. Lines predicted by generalized Poisson density equation (Adapted from Ouyang et al., 2017).