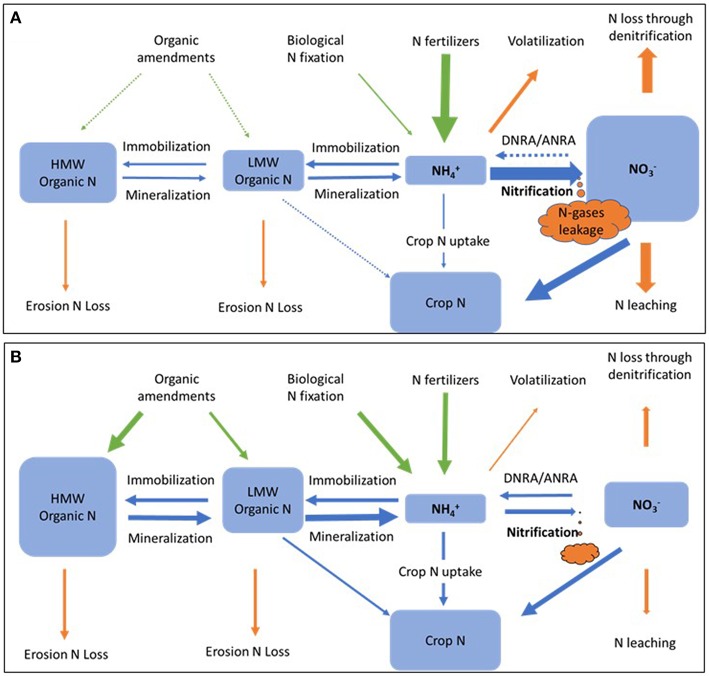
Figure 6.
Hypothetic nitrogen pools and flows of high-nitrifying (A) and low-nitrifying (B) agricultural systems. Arrows represent nitrogen inputs (green), losses (orange), and transformations (blue). HMW, high molecular weight; LMW, low molecular weight; DNRA, dissimilatory nitrate reduction to ammonium; ANRA, assimilatory nitrate reduction to ammonium.

