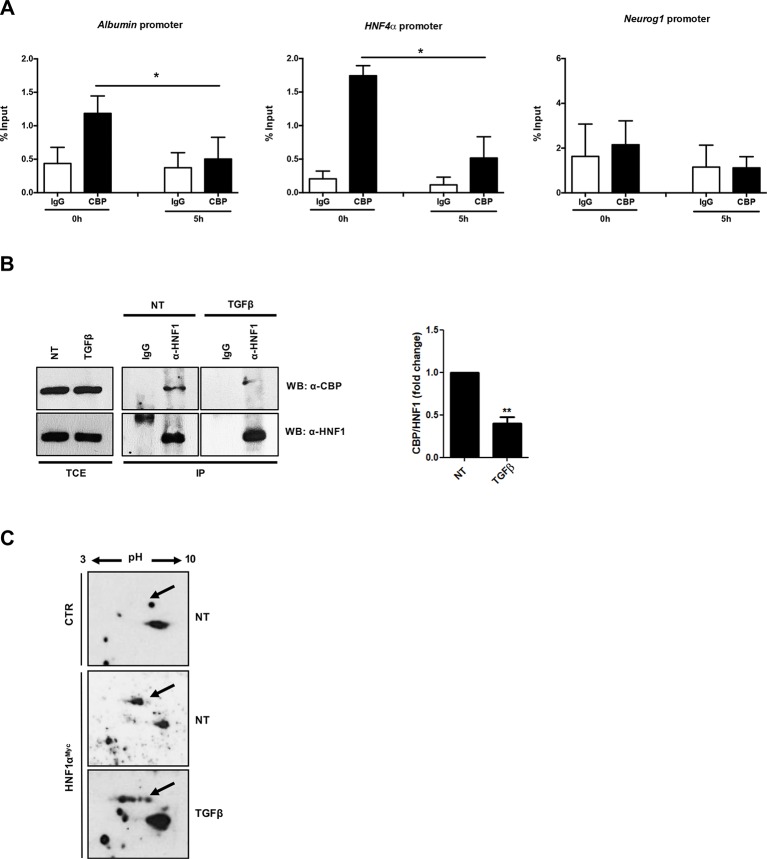
Figure 4.
(A) Analysis of CBP/p300 DNA binding activity after TGFβ treatment. qPCR analysis of chromatin immunoprecipitated with anti-CBP/p300 antibody from hepatocytes untreated or treated with TGFβ (for 5 h) was performed. HNF1α consensus regions embedded in the indicated target gene promoters were analyzed. A HNF1α nonbound region of Neurogenin 1 promoter was utilized as negative control. Data are normalized to total chromatin input and background (control immunoprecipitation with IgG) and expressed as % input. Mean ± SEM of qPCR data obtained in triplicate from three independent experiments are reported. (B) In vivo coimmunoprecipitation of HNF1α and CBP/p300 in hepatocytes untreated or treated with TGFβ (for 5 h). Cells were lysed, immunoprecipitated with anti-HNF1α antibody, and then analyzed by Western blotting with the indicated antibodies. As control, the immunoprecipitation with normal goat IgG was performed. TCE, total cell extracts. Densitometric analysis of WB data from three independent experiments is shown. (C) Analysis of HNF1α protein PTMs following TGFβ treatment. Nuclear extracts from control hepatocytes (upper panel) and HNF1αMyc-overexpressing hepatocytes treated for 3 h with TGFβ (lower panel) or left untreated (middle panel). Samples were separated by two-dimensional gel electrophoresis followed by Western blotting with anti-Myc-Tag antibody. HNF1α-specific spots are indicated by the arrow. The appearance of multiple spots in TGFβ-treated hepatocytes can be observed. **p <0.05, **p<0.01.

